BY TYLER DURDEN MONDAY, APR 19, 2021 – 11:25 AM
After Friday’s big option expiration, SpotGamma points out that both QQQ and IWM start the week at/in a negative gamma position, which implies higher relative volatility in those indices.
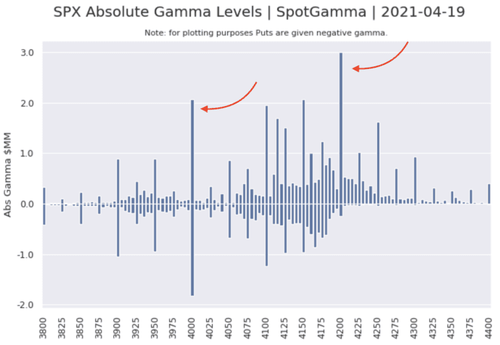
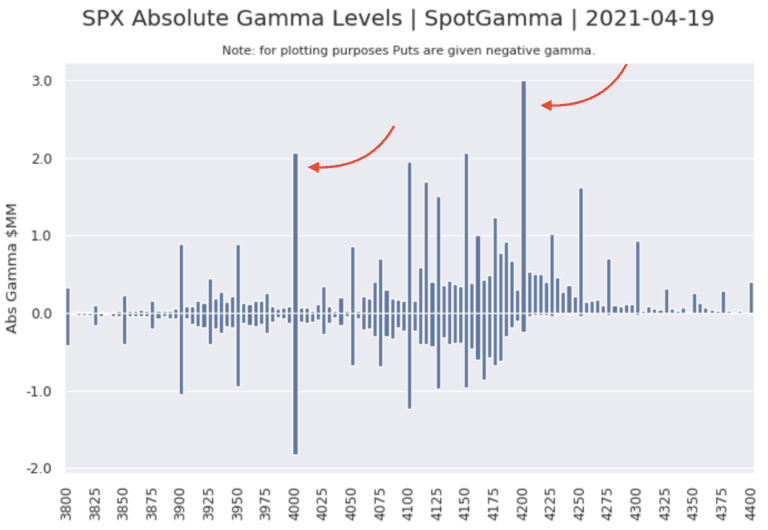
There is also now a very wide range in distribution of SPX gamma (gamma is shallow and evenly dispersed 4100-4200 with a large “void” from 4100-4000).
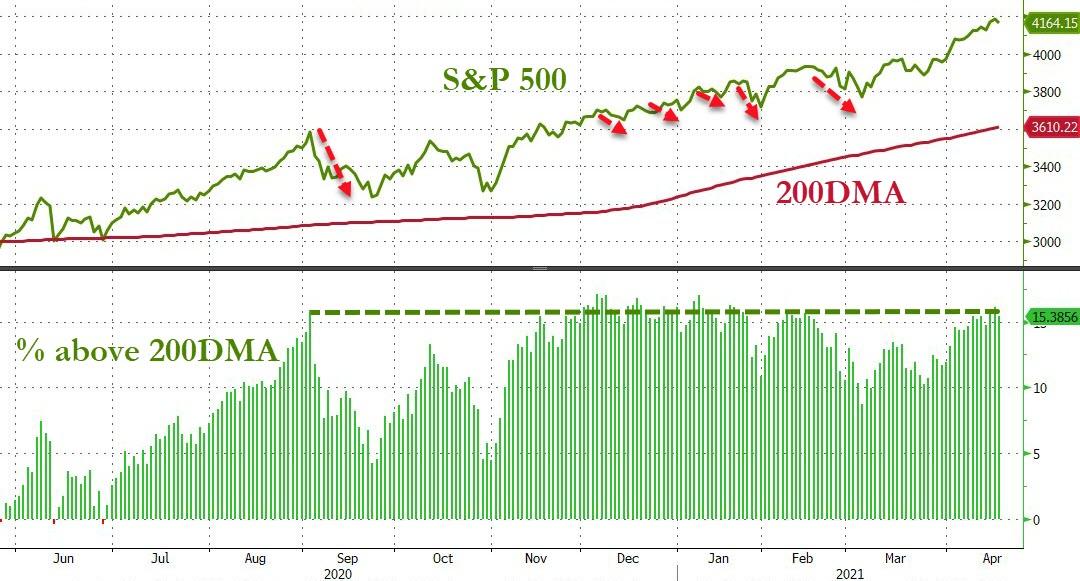
The potential for higher volatility is reinforced by the fact that the S&P 500 is extremely stretched on a price-time basis. As Bloomberg’s Kriti Gupta notes, the S&P 500 is currently trading at around 16% above its 200-day moving-average (200DMA) – a level that seems to have spurred a selloff in the last eight months.
Source: Bloomberg
The 16% figure coincided with a 10% correction during the September tech wreck, a 2% drop in November and December, and then ~5% selloffs in January and February.
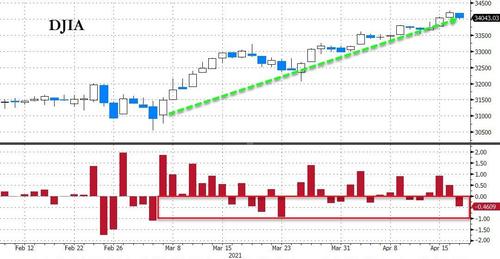
If we do get a ‘storm’ it will be coming after a shocking period of ‘calm’ (as liquidity provisions overwhelmed the global chaos) with The Dow Jones Industrial Average now having gone 30 days without a loss of more than 1%… the longest streak since right before the pandemic.

Source: Bloomberg
The calm across equity markets has coincided with a drop in trading activity. S&P 500 average trading volume as a share of market cap thus far in April has registered as the lowest since January 2020.
But, as SpotGamma notes, there is a VIX expiration on Wednesday which could shake things up, too… which fits with what Goldman Sachs’ Rocky Fishman is warning.
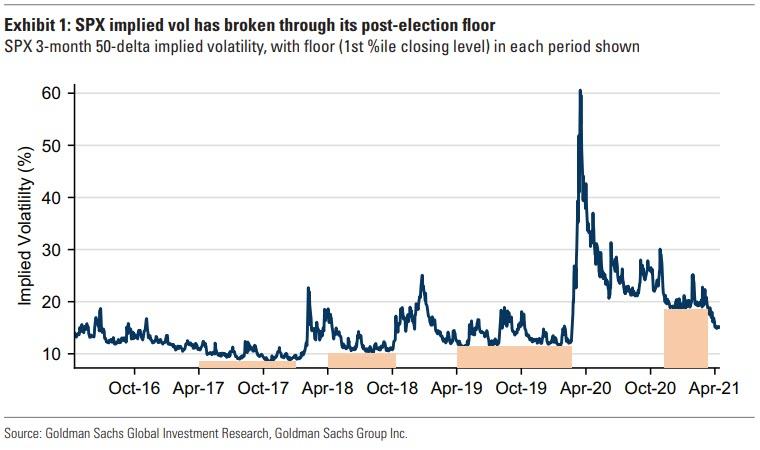
The nearly 10% rally for the SPX over the past six weeks has pushed the VIX down below 17 for the first time in the COVID era. The floor in implied volatility that has held since the aftermath of November’s elections was broken by several vol points. In Goldman’s view, this is an opportunity to add to short-dated hedges, as they expect a return to 2021’s prevailing high volatility risk premium before long.
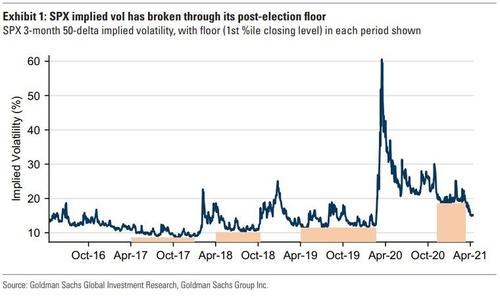
Interestingly, VIX has been hitting lower levels with each SPX high – reversing the trend of 2018-2020.
Throughout the rally of 2021, the VIX has been falling, and hitting new lows each time the SPX hits a new high. While negative volatility-spot correlation is not unusual, it is a break from the trend of the last three years, in which new highs were often associated with nervousness about valuation levels.
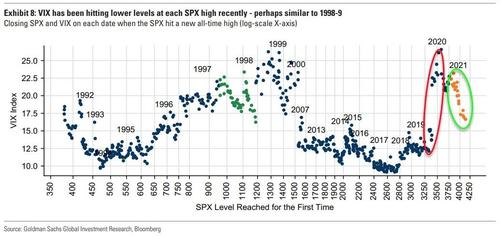
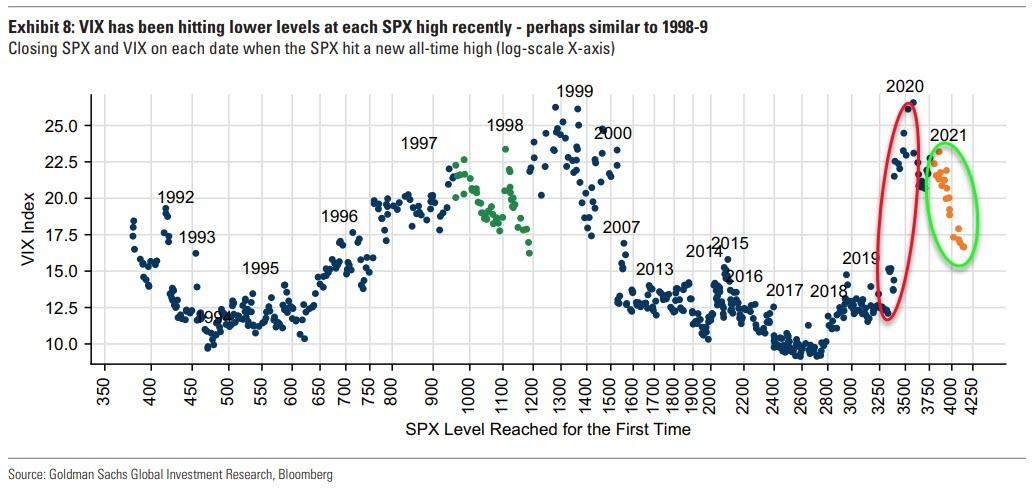
The shift from rising spot levels at new highs to a regime of lower vol with each new high resembles 1997 and 1998 (highlighted in green); in each of those years, the aftermath of a major event left a period of new VIX lows with each SPX high, but markets became much more volatile soon thereafter in each case.
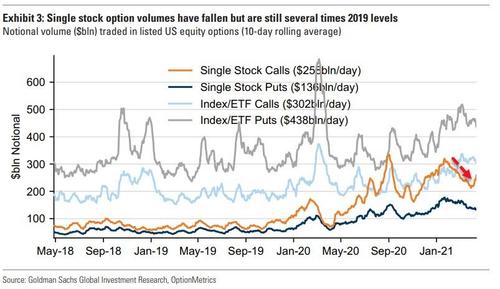
On a side note, Goldman points out that one contributing factor to the past weeks’ slide in implied volatility has been a reduction in single stock call buying. However, the current level of single stock option activity remains extremely high compared with any period prior to COVID, and we see single stock options as a continued, significant, source of demand for optionality.
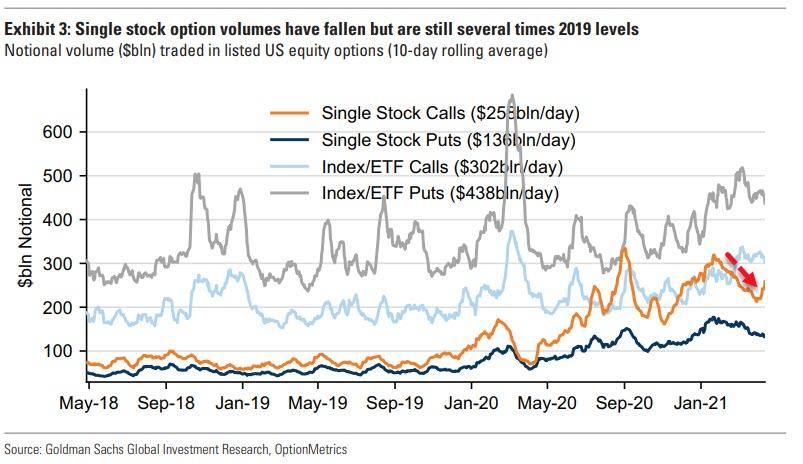
However, while slowing interest rate volatility and outperformance in the vaccine rollout to DM countries have likely contributed to investor optimism that reduces demand for hedging, Goldman warns that as valuations rise and investors consider potential impact of several near-term risks, expect a return toward 2021’s prevailing high volatility risk premium in the coming weeks.
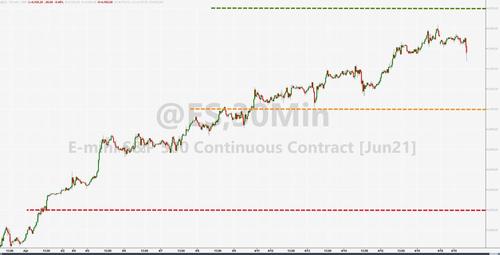
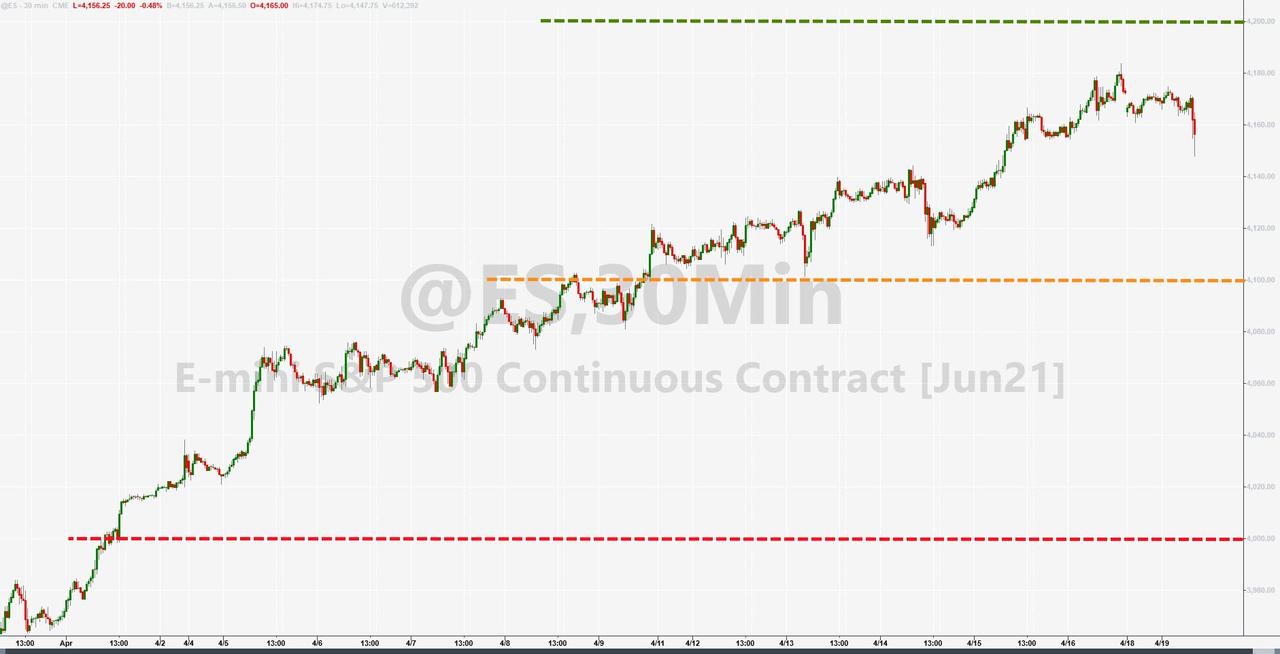
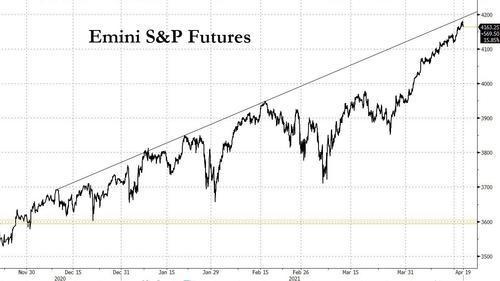
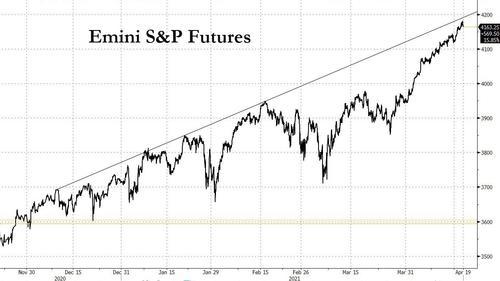
If one looks purely at technicals (i.e., lines drawn on a chart which somehow predict stuff), the latest ramp was to be expected, but appears to be reaching an exhaustion point with just 10 points to go until resistance is hit.
And, as JPMorgan recently noted … as “the combination [of a growing divergence in the sleepy VIX relative to the spiky MOVE Index, and a rise in the put-call ratio] seems to suggest an increasing nervousness among investors.“