• Skip to content
  • Skip to primary sidebar

SpotGamma™

S&P 500 Stock Market Gamma Trading Levels Based on Options Open Interest

  • Subscribe Now
  • Products
  • Blog
  • FAQ
  • Contact
    • About
  • Members
    • Account
    • Portal
    • Equity Hub 2.0

Dec 09 2019

December 2019 Market Decline Review

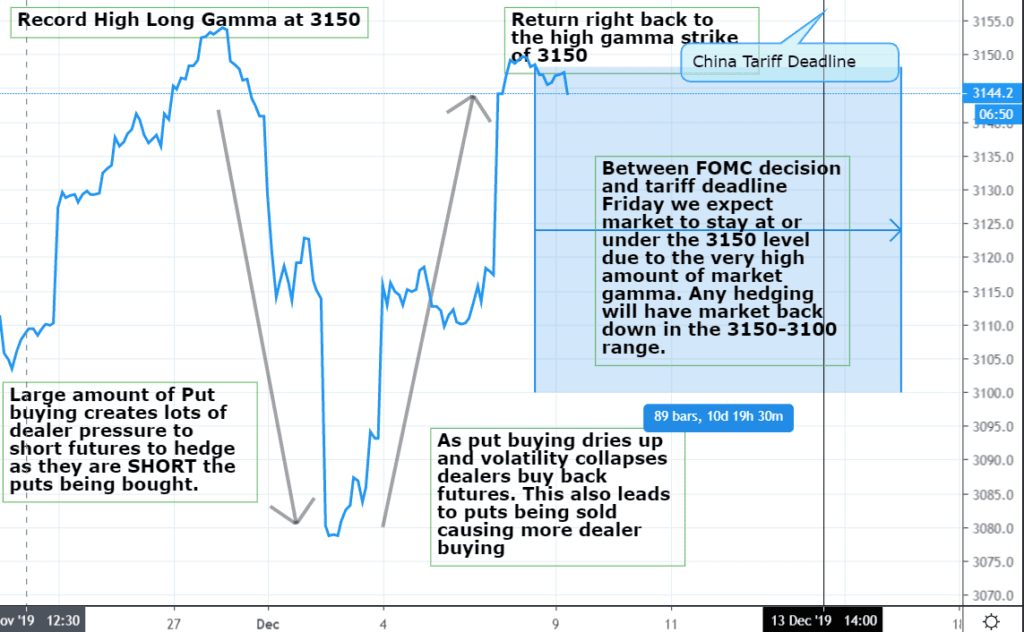
Here is a chart outlining how we saw the selloff during the first week of December 2019. There was record high gamma going into the first week of December which indicates that call:put ratios were at extremes. After a few negative tweets about trade and a poor ISM number selling started, and put buyers stepped in. This included one particularly large put buyer in the January 2980 puts. As people buy puts dealers are short those puts. To hedge they must sell futures.

After volatility calms these puts start losing value (and/or puts are sold) and force dealers to buy back futures. Its our opinion this is one cause for these “V” type moves.

December 2019 Selloff SPX
  • Click to share on Twitter (Opens in new window)
  • Click to share on Facebook (Opens in new window)
  • Click to share on LinkedIn (Opens in new window)
  • Click to share on Reddit (Opens in new window)

Written by Spot Gamma · Categorized: Market Analysis · Tagged: gamma, hedging, put buying

Primary Sidebar

Popular Posts

spotgamma-sidebar-weaponized-gamma-sidebar
spotgamma-sidebar-yolo-trade
did-softbank-weaponize-options-gamma-whale
goldman-gamma-op-ex-option-driven-equity-flow
spotgamma-on-the-market-huddle

Categories

  • Dark Pool (1)
  • Market Analysis (262)
  • SpotGamma Updates (4)
  • Stock (47)
  • Trade (3)
Follow @spotgamma on Twitter!
  • Subscribe
  • Disclaimer
  • Account
  • Portal

©2021 TenTen Capital LLC DBA SpotGamma