• Skip to main content
  • Skip to primary sidebar

SpotGamma™

S&P 500 Stock Market Gamma Trading Levels Based on Options Open Interest

  • About
  • Pricing
  • Academy
  • Resources
    • Tool Demos
    • Case Studies
    • Blog
    • Support Center
    • Daily Report
    • Free Trading Tools
      • Opening Setup Free Report
      • Options Profit Calculator
      • SPX Gamma Exposure
      • Implied Earnings Moves
    • Report Card
  • Login

hedging

Nov 02 2026

Relatively Few Traders Are Positioned For The Right Tail

Relatively Few Traders Are Positioned For The Right Tail

SPX right tail risk may be under-owned: the whole vol surface lifted, flows leaned to call spreads, and put flies cap the cost of hedging 7,600.

Written by SpotGamma · Categorized: Market Analysis · Tagged: 0DTE, AAPL, hedging, implied volatility, META, ORCL, skew, SPX, tastylive

Oct 23 2026

Rising Correlation Is Thinning Out The Rotation Trade

Rising Correlation Is Thinning Out The Rotation Trade

Rising correlation, firmer fixed-strike vol and steeper 3-month put skew suggest the rotation trade is weakening. See where hedges still look cheap.

Written by SpotGamma · Categorized: Market Analysis · Tagged: Brent Kochuba, correlation, hedging, implied volatility, IWM, put skew, SMH, SPY, tastylive

Oct 14 2026

CYTK: A $390K Options Bet Targets November FDA Catalyst
CYTK: Options Traders Position for a November FDA Catalyst

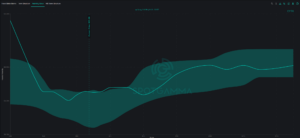
Cytokinetics (CYTK) is setting up as an interesting event-driven biotech trade into November, with the options market beginning to position around a major FDA decision while the stock sits near the lower end of its recent range.

Written by SpotGamma · Categorized: Market Analysis · Tagged: biotech, call spread, gamma, hedging, implied volatility

Oct 01 2026

Index Put Protection Is Cheap With 10-Year Treasury Bonds at 5.3%

Index Put Protection Is Cheap With the 10-Year at 5.3%

SpotGamma founder Brent Kochuba joined tastylive to explain why index put protection stays cheap with the 10-year at 5.3% and bond volatility climbing.

Written by SpotGamma · Categorized: Market Analysis · Tagged: bond yields, hedging, implied volatility, negative gamma, put skew, tastylive, TLT, VIX, volatility risk premium

Apr 01 2026

GEX & JPM Collar: SpotGamma on TastyTrade
Brent SpotGamma talks with TastyTrade live about JPM Collar Trade, GEX and DEX

How Options Market Structure Controls Intraday Price Action: GEX, Dealer Hedging, and the JP Morgan Collar Trade Most traders watch price. Sophisticated traders watch flow. But the traders with real structural edge watch what dealers are forced to do — because when the biggest participants in the world’s largest options complex are compelled to hedge, markets move […]

Written by SpotGamma · Categorized: Market Analysis · Tagged: DEX, gamma hedging, GEX, hedging, JPM Collar

Apr 20 2022

The Fed Meeting May Spark The Next Stock Market Rally
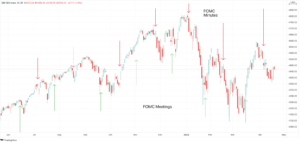
Fade The FOMC Minutes

The following is a guest post courtesy of Michael Kramer of Mott Capital Management.  Buy the Fed meeting. Sell the Fed minutes.  It may be the name of the game for the stock market. At least since the start of 2022, the minutes have been a cause of concern for markets, while the FOMC meetings […]

Written by SpotGamma · Categorized: Market Analysis · Tagged: FED, FOMC, hedging, HIRO Indicator, Michael Kramer, vanna

Jun 13 2020

June Selloff Review

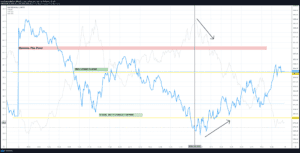
The chart shows S&P 500 and VIX lines with Gamma Flip Zone, max combo strike, and largest gamma strike labeled.

Markets were unable to hold gains on Friday after a sharp selloff on Thursday. While we initially opened over the gamma flip zone, markets broke that 3075 area and immediately sold down to the 3000 strike. This 3000 level is where we calculated the most options gamma and served as support. All of these levels […]

Written by SpotGamma · Categorized: Market Analysis · Tagged: gamma flip, hedging, market crash, negative gamma

Jan 24 2020

Hedging Into the Close

Table of K-values on both sides of x markers and a blue column of numbers from 3310 to 3285 with one darker highlighted row.

@VolCurve brought up a great point today – ” Don’t mistake gamma hedging for strength.” It was an interesting example today of what looks like gamma hedging moving the market into the close. The market was quite weak today, but some force kept bringing us higher towards 3300 into the close. SPX options settle at […]

Written by SpotGamma · Categorized: Market Analysis · Tagged: drift, hedging, OPEX

Dec 20 2019

Options Market Gamma Theory is All About Volume
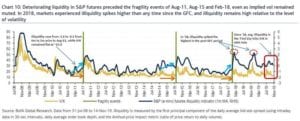
Line chart comparing VIX and S&P e-mini futures illiquidity from 2008 to 2019 with green event markers.

Options market gamma numbers proliferate the market but its important to understand what exactly those numbers mean. Yes, positive gamma may indicate lower stock volatility. And when gamma flips from positive to negative that may indicate higher volatility. But the actual gamma number itself is an estimate of how much stock dealers will have to […]

Written by SpotGamma · Categorized: Market Analysis · Tagged: futures, gamma impact, hedging, illiquidity, volume

Dec 09 2019

December 2019 Market Decline Review

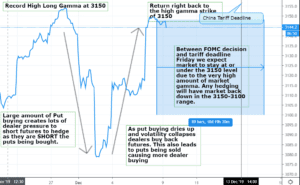
Line chart of Nov-Dec 2019 prices annotated around 3150 gamma, dealer put hedging, and China tariff deadline.

Here is a chart outlining how we saw the selloff during the first week of December 2019. There was record high gamma going into the first week of December which indicates that call:put ratios were at extremes. After a few negative tweets about trade and a poor ISM number selling started, and put buyers stepped […]

Written by SpotGamma · Categorized: Market Analysis · Tagged: gamma, hedging, put buying

  • Go to page 1
  • Go to page 2
  • Go to Next Page »

Primary Sidebar

SpotGamma-Subscriber-Signup-Banner

  • Tech Vol Collapsed, Put Skew Held Rich: Options Action Live on CNBC
  • Gamma Guy: The 0DTE Flow That Usually Pins the Index Didn’t Arrive
  • AMD Earnings Preview: Can AI Growth Overcome Rising Volatility and Expectations?
  • Relatively Few Traders Are Positioned For The Right Tail
  • Palantir (PLTR) Earnings Preview: Can AI Growth Justify Another Explosive Move?
  • youtube
  • x
  • Privacy Policy
  • Disclaimer
  • Terms & Conditions
  • Support Center
  • Media
  • Contact Us

©2026 TenTen Capital LLC DBA SpotGamma

All SpotGamma materials, information, and presentations are for educational purposes only and should not be considered specific investment advice nor recommendations. Futures, foreign currency and options trading contains substantial risk and is not for every investor. An investor could potentially lose all or more than the initial investment. Risk capital is money that can be lost without jeopardizing one's financial security or lifestyle. Only risk capital should be used for trading and only those with sufficient risk capital should consider trading. Past performance is not necessarily indicative of future results. Testimonials appearing on this website may not be representative of other clients or customers and is not a guarantee of future performance or success.

View Full Risk Disclosure