Equity Markets Could Rally into VIX Expiration
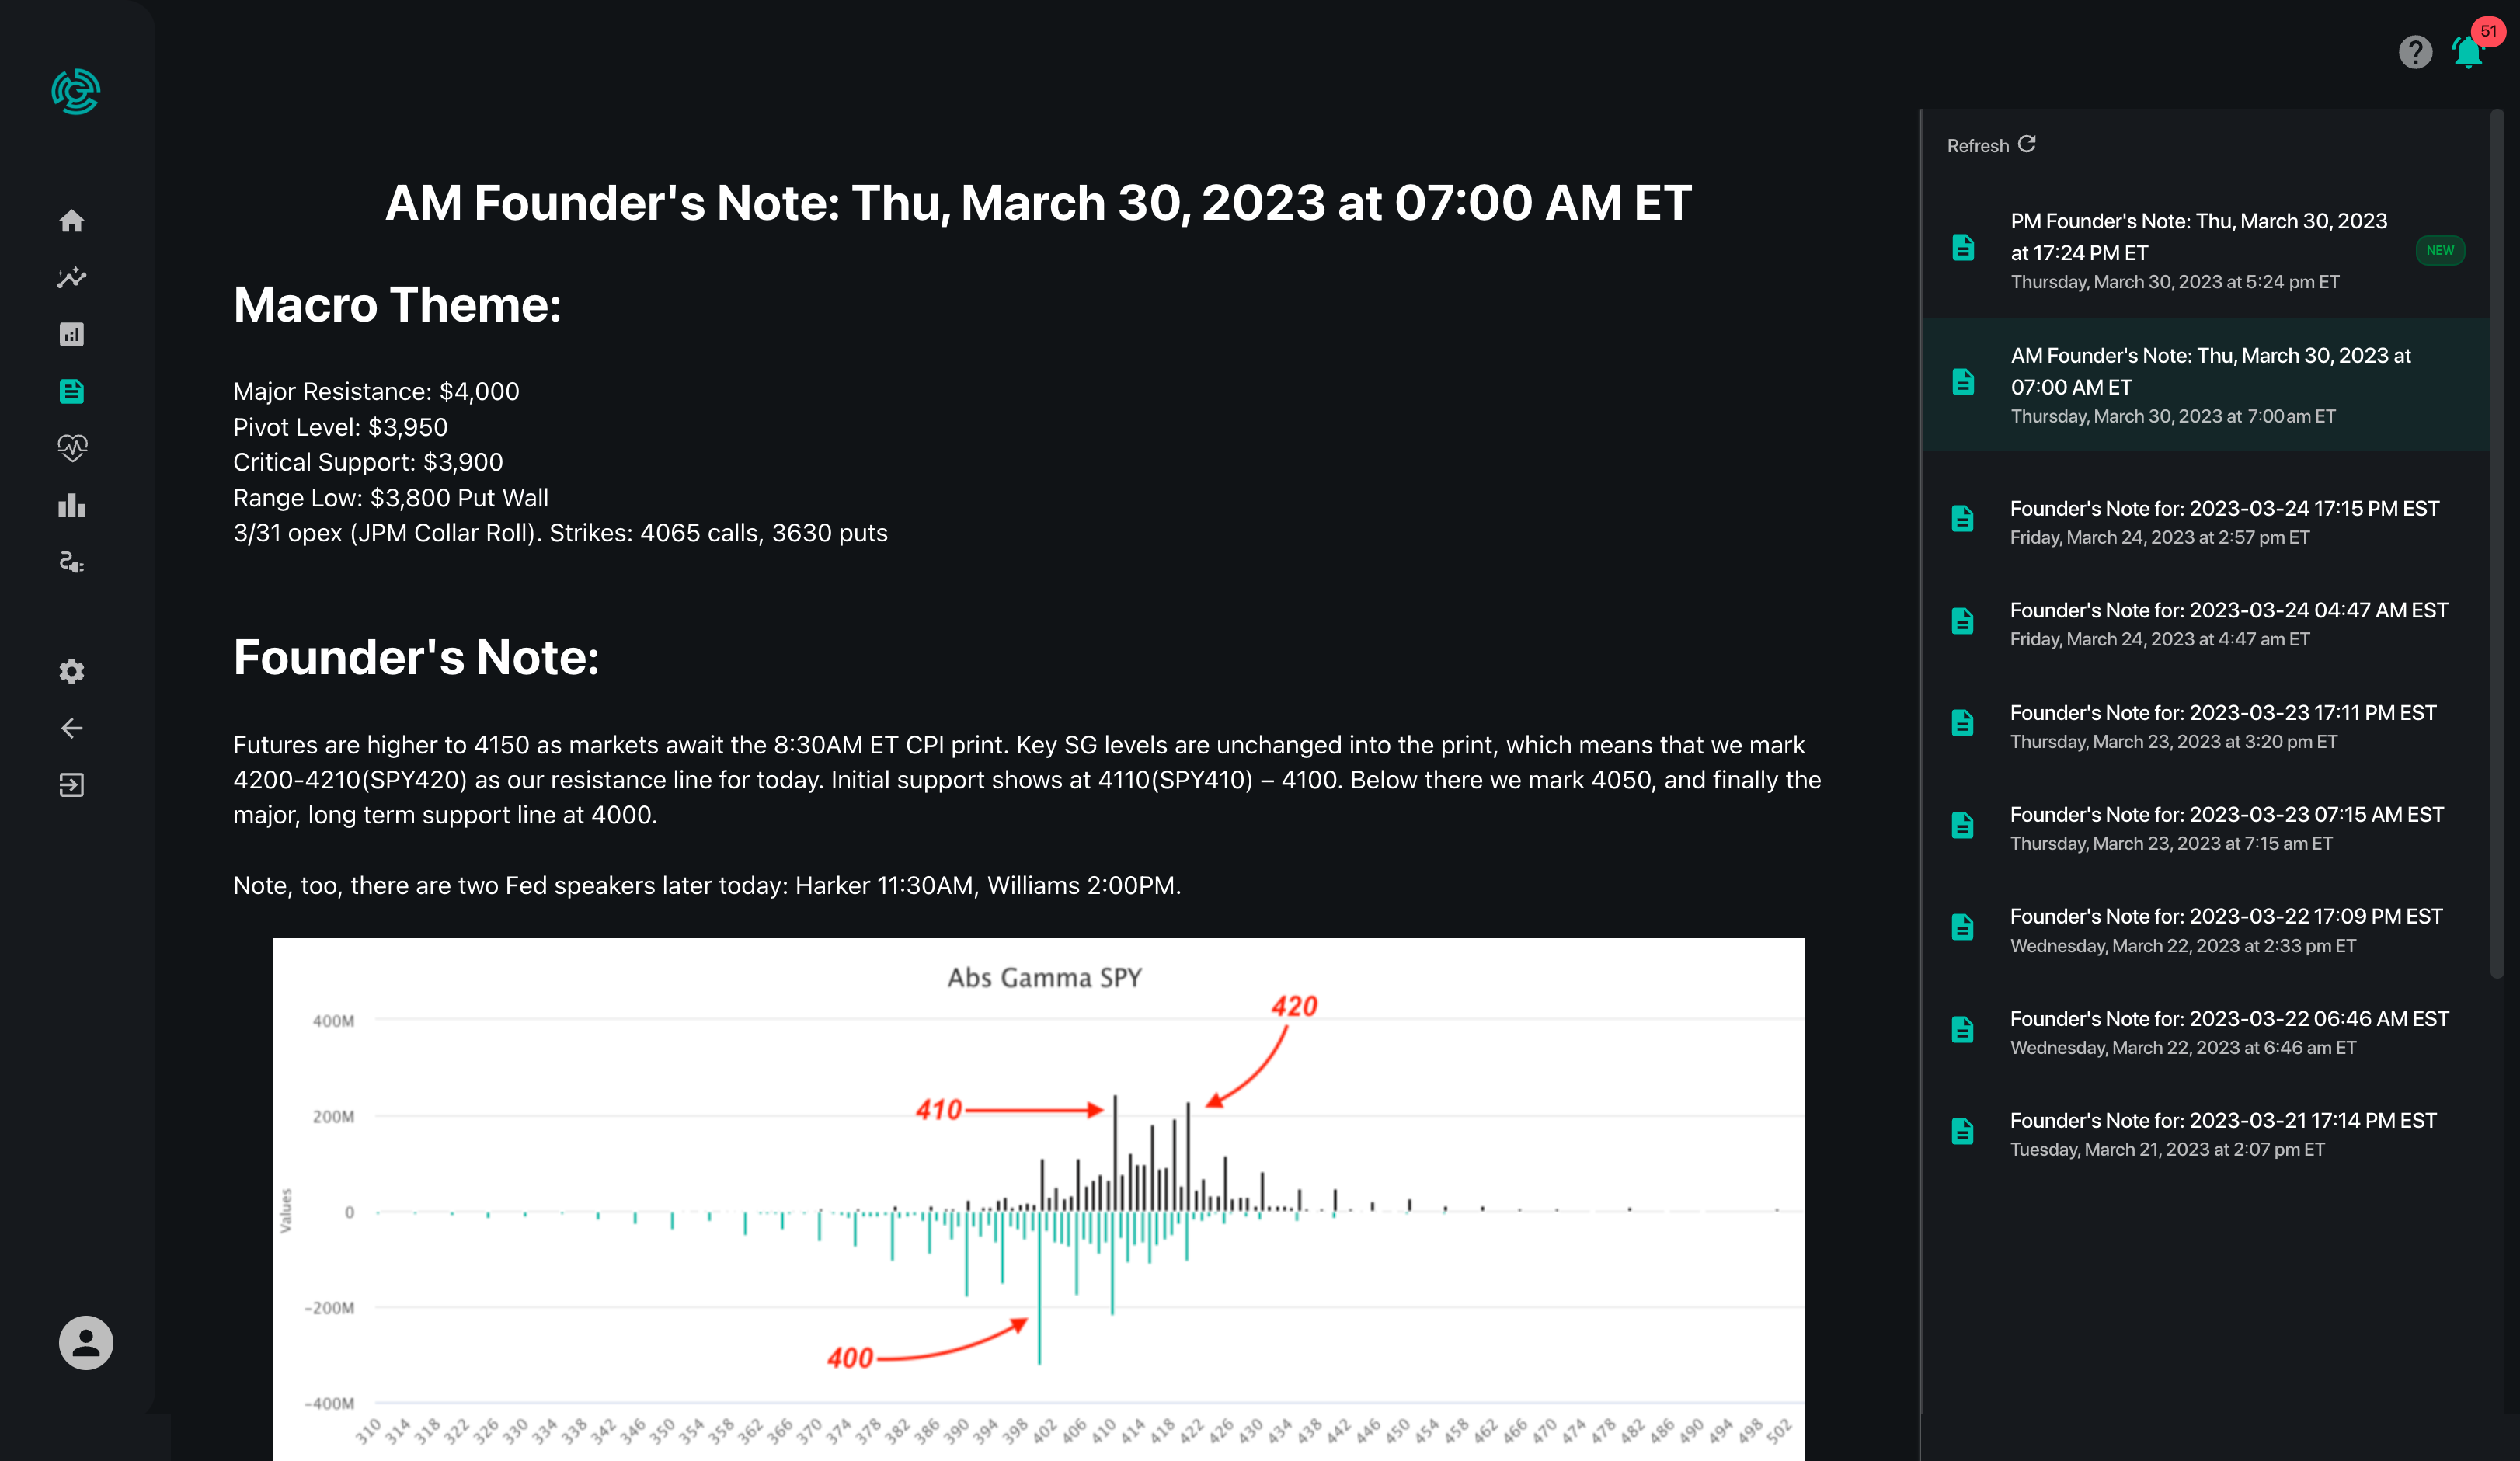
Macro Theme:
Market Context: Rallies should be categorized as short covering and subject to failure.
S&P 500 Levels:
- $4,000.00 is significant overhead resistance.
- $3,900.00 is a pivot above which volatility should decrease.
- $3,800.00 is major support below which there may be an accelerated sell-off.
What To Watch:
- Larger ranges following the July 15 (equity) and July 20 (VIX) options expirations.
- Equity markets may jump into the Wednesday, July 20, 2022, VIX expiration.
- Implied volatility is likely to rise as we approach the July 27, 2022, FOMC event.
Daily Note:
Futures are higher to 3865 overnight. We once again look for ~1% swings today with resistance at 3900-3910. Support shows at 3850 then 3800.
Today is the last trading day before VIX expiration, and this day has been associated with strength in recent months (see yesterdays note). We also believe that as IV starts to catch a bid, which creates an equity headwind as we advance towards next weeks 7/27 FOMC. Increasing implied volatility would drive put prices higher, which infers dealers needing short deltas to hedge.
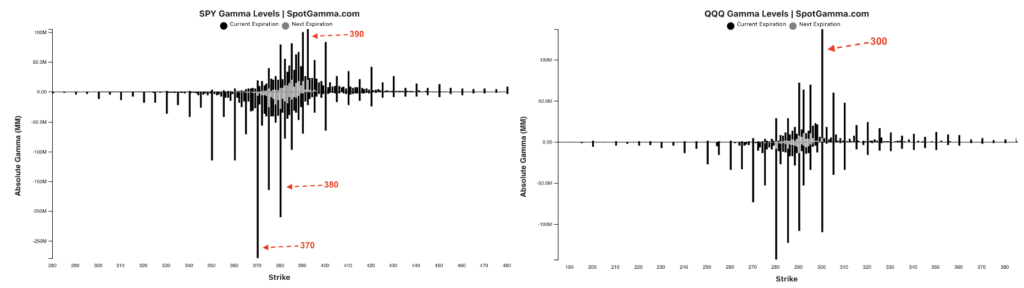
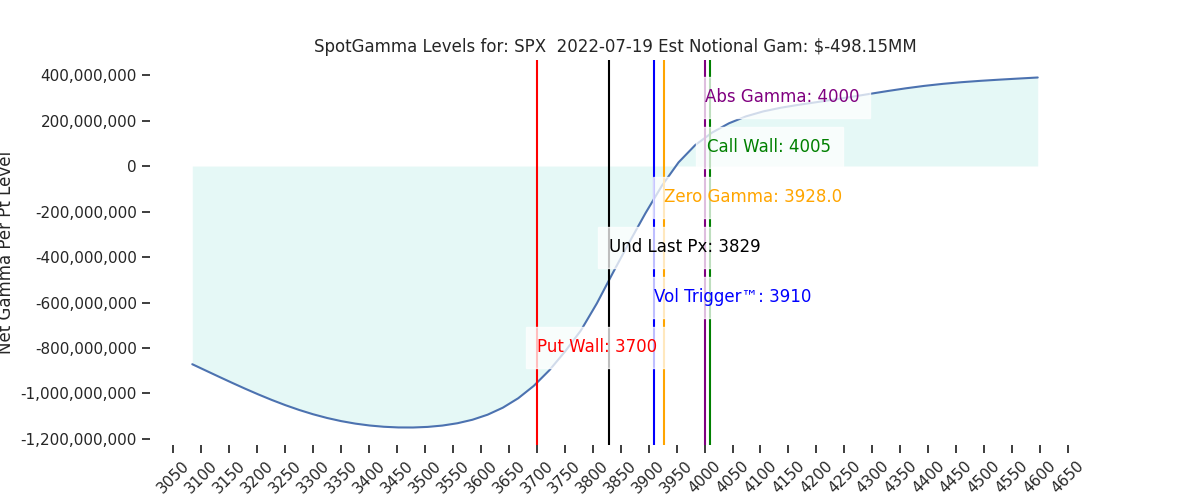
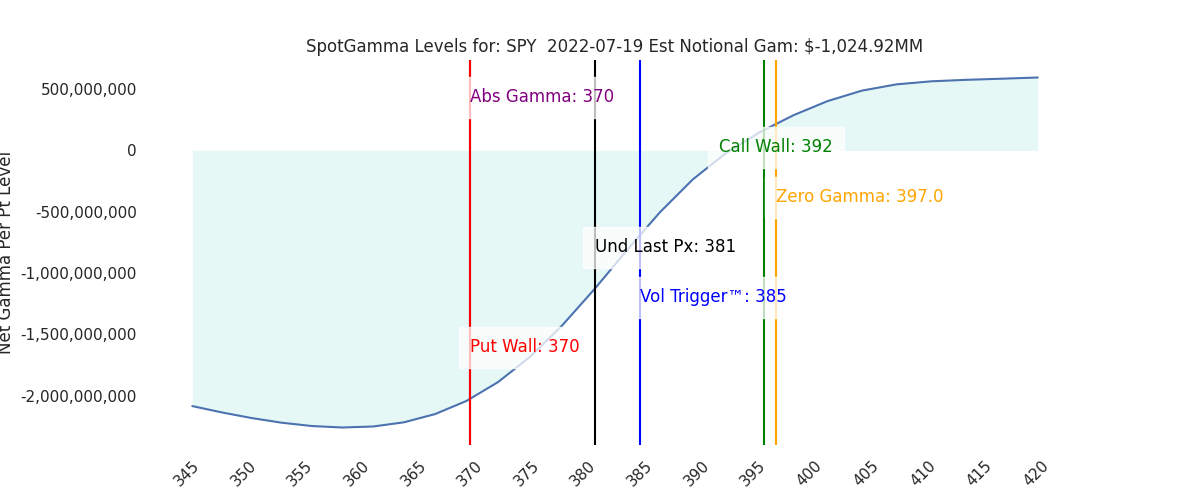
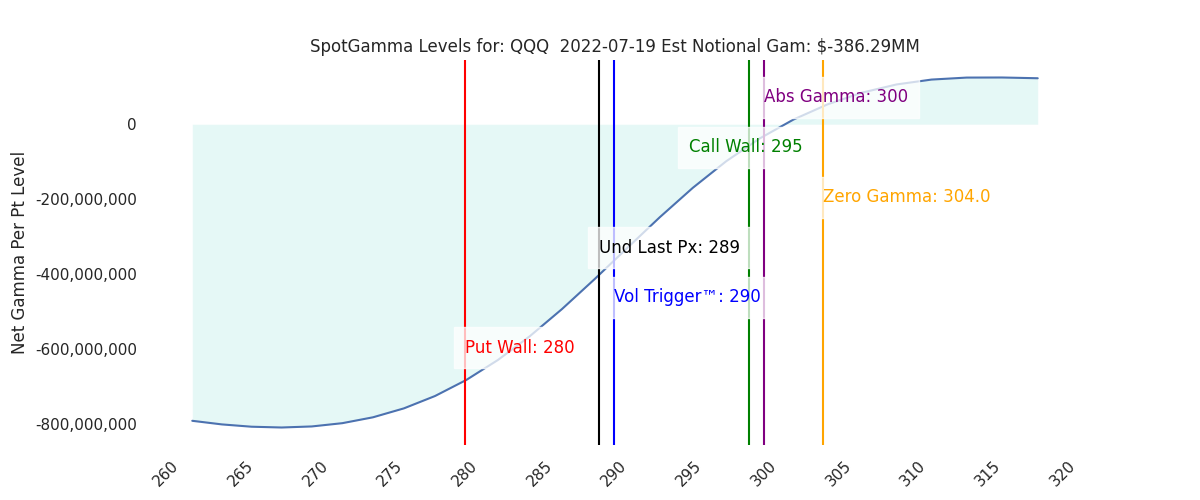
We’ve been marking 3900 as this hurdle that the market needs to cross in order for volatility to trend lower. While 3900 is not the Call Wall for SPX, it is the Call Wall for SPY (392), and a large gamma area as shown below (left). We also see large resistance at 300 in QQQ, too (right).
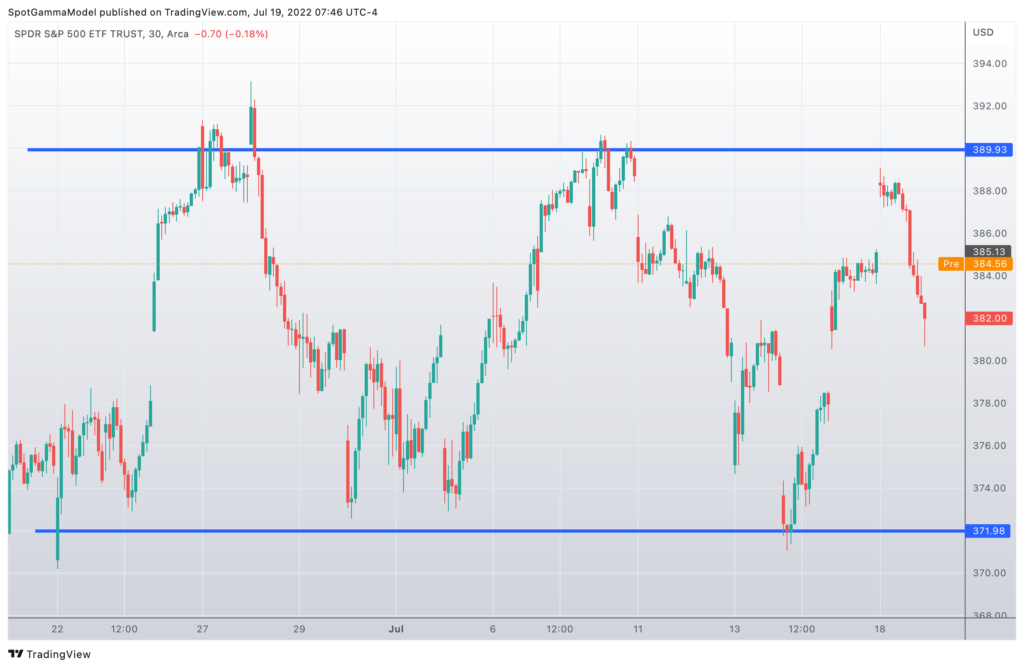
This 390/3900 level has proven to be resistance several times over the past month. Based on current premarket trading levels (SPY ~385) and our volatility estimate (1 SD move = 1.17%) this 390/3900 resistance level is in play for today. However, as noted above, this strike could be challenged at a time wherein the options market dynamics change from an equity tailwind to headwind.
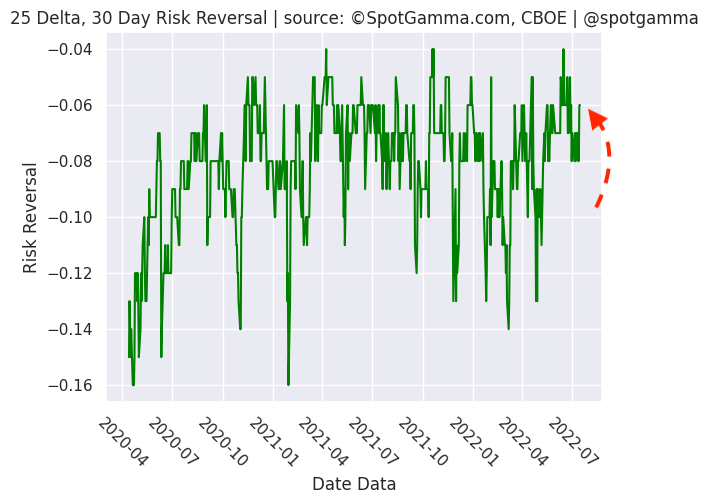
Our skew model continues to measure low put demand as traders focus starts to shift toward the FOMC. We don’t think traders will suddenly grab for tail risk hedges into FOMC, as demand for this protection has been absent of late (ex: TDEX). We do think there will be a general bid for put protection, particularly in shorter duration (i.e. traders buying next weeks puts).
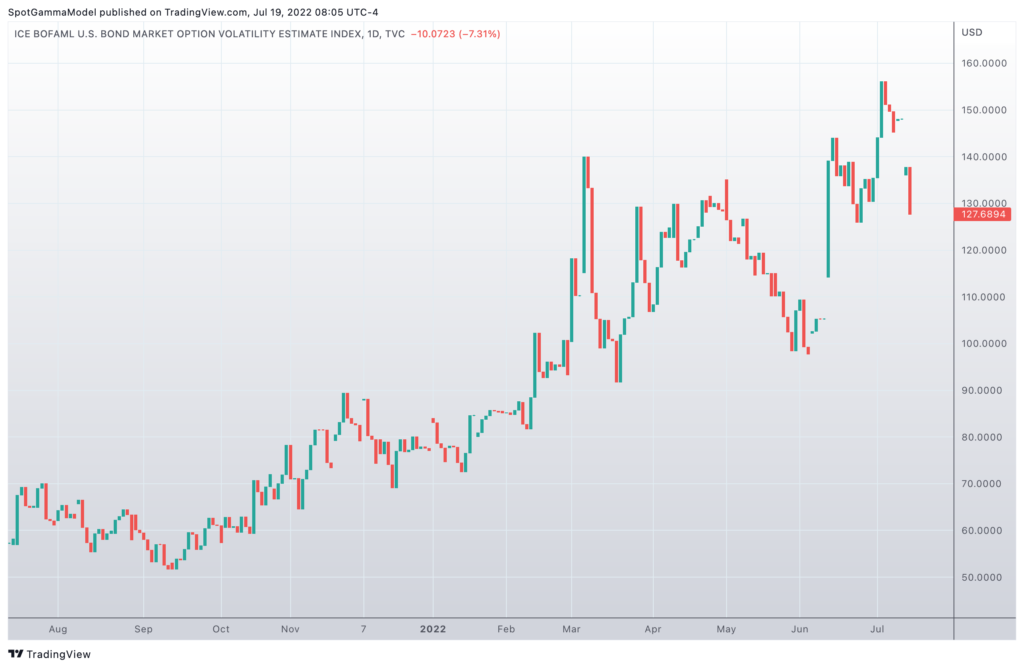
On a larger time frame we’ve been of the opinion that the market cannot hold an extended rally until the bond market settles down. We’ve been watching the MOVE Index (aka bond VIX) as general barometer for bond market anxiety, and it appears the stress is easing some. If Powell can better set interest rate expectations next week, that could pave the way for MOVE drop and equity rally.
To confirm a rally setup, will be looking for long call positions to build in/around the 4000 level in conjunction with a lower move. Without those two signals (MOVE + call demand) lining up its likely this 3900-4000 area remains resistance for several weeks.
| SpotGamma Proprietary SPX Levels | Latest Data | SPX Previous | SPY | NDX | QQQ |
|---|---|---|---|---|---|
| Ref Price: | 3829 | 3824 | 381 | 11877 | 289 |
| SpotGamma Imp. 1 Day Move: Est 1 StdDev Open to Close Range | 1.17%, | (±pts): 45.0 | VIX 1 Day Impl. Move:1.6% | ||
| SpotGamma Imp. 5 Day Move: | 3.05% | 3861 (Monday Ref Px) | Range: 3744.0 | 3979.0 | ||
| SpotGamma Gamma Index™: | -0.90 | -0.47 | -0.19 | 0.01 | -0.06 |
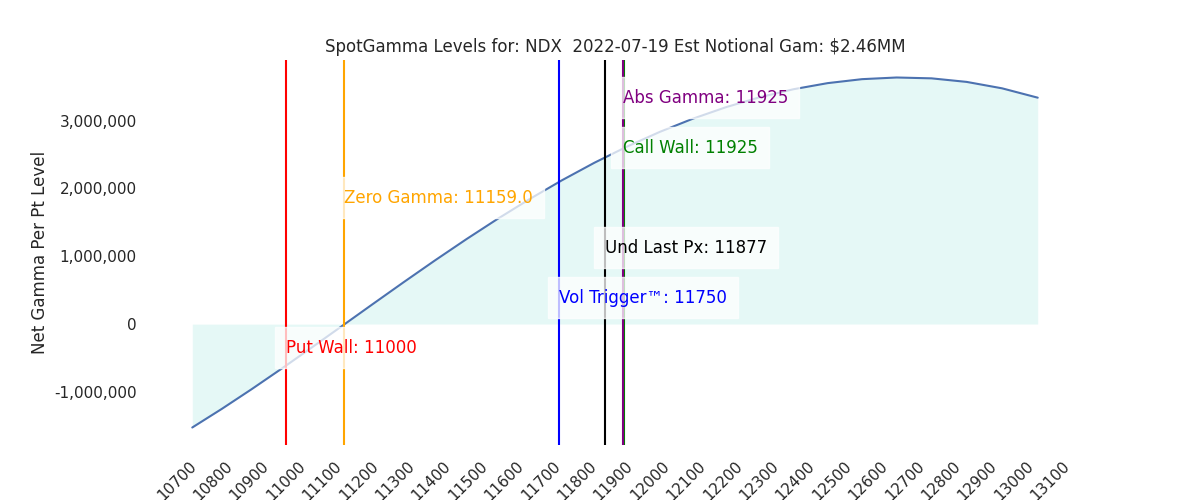
| Volatility Trigger™: | 3910 | 3840 | 385 | 11750 | 290 |
| SpotGamma Absolute Gamma Strike: | 4000 | 4000 | 370 | 11925 | 300 |
| Gamma Notional(MM): | -498.0 | -509.65 | -1025.0 | 2.0 | -386.0 |
| Additional Key Levels | Latest Data | Previous | SPY | NDX | QQQ |
|---|---|---|---|---|---|
| Zero Gamma Level: | 3928 | 3952 | 0 | 0 | 0 |
| Put Wall Support: | 3700 | 3700 | 370 | 11000 | 280 |
| Call Wall Strike: | 4005 | 4005 | 392 | 11925 | 295 |
| CP Gam Tilt: | 0.71 | 0.68 | 0.63 | 1.28 | 0.71 |
| Delta Neutral Px: | 4003 | ||||
| Net Delta(MM): | $1,411,737 | $1,367,785 | $153,110 | $47,206 | $89,513 |
| 25D Risk Reversal | -0.06 | -0.06 | -0.06 | -0.07 | -0.07 |
| Call Volume | 393,535 | 406,147 | 1,597,229 | 7,259 | 728,667 |
| Put Volume | 724,857 | 728,583 | 2,708,666 | 7,039 | 883,169 |
| Call Open Interest | 5,314,869 | 5,170,237 | 6,481,450 | 55,713 | 3,814,398 |
| Put Open Interest | 9,017,317 | 8,966,761 | 10,206,300 | 51,796 | 5,779,165 |
| Key Support & Resistance Strikes: |
|---|
| SPX: [4000, 3900, 3850, 3800] |
| SPY: [385, 380, 375, 370] |
| QQQ: [300, 290, 285, 280] |
| NDX:[13000, 12500, 12000, 11925] |
| SPX Combo (strike, %ile): [3799.0, 3749.0, 3772.0, 3822.0] |
| SPY Combo: [378.89, 373.93, 376.22, 381.19] |
| NDX Combo: [11925.0, 11699.0, 12103.0] |
| ©TenTen Capital LLC d.b.a. SpotGamma Please leave us a review: Click Here |
| See the FAQ for more information on reading the SpotGamma graph. |
| SpotGamma provides this information for research purposes only. It is not investment advice. SpotGamma is not qualified to provide investment advice, nor does it guarantee the accuracy of the information provided. This email is intended solely for subscribers, please do not distribute the information without the express written consent of SpotGamma.com. |