Look Out For the “Sucker Punch” Rally Reversing Lower
Macro Theme: |
Key Levels: |
|
> New ranges currently forming after Oct OPEX. We anticipate high volatility as markets set a new directional trend > We hold a bullish edge to markets while the SPX is > Vol Trigger (3820) > Range Into Nov OPEX (11/18): Top: 3955 | Bottom: 3600 |
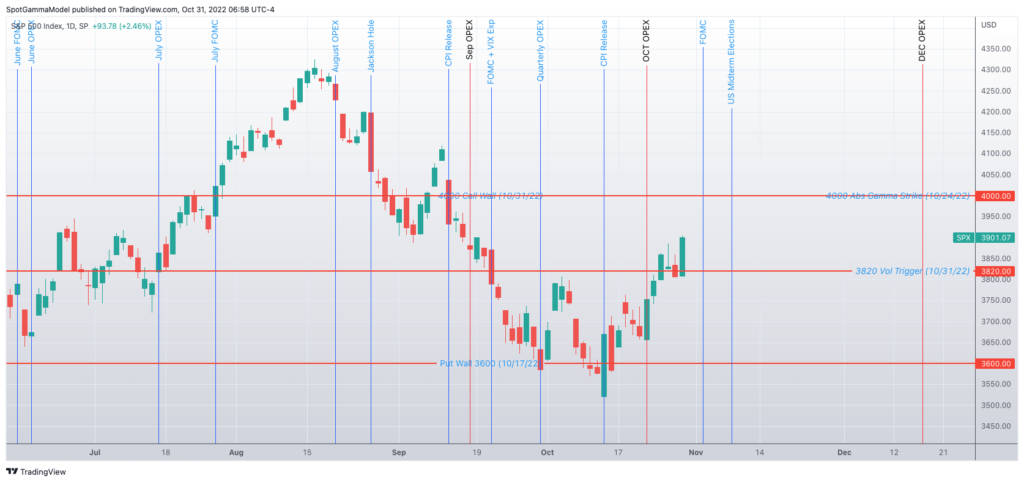
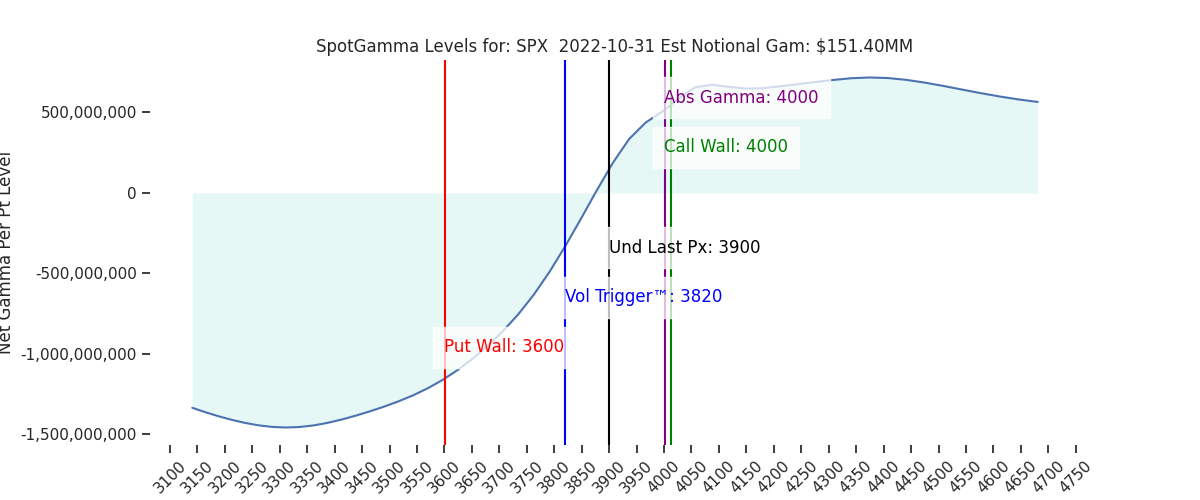
Ref Price: 3900 SG Implied 1-Day Move: 1.2% SG Implied 5-Day Move: 3.15% Volatility Trigger: 3820 Absolute Gamma Strike: 4000 Call Wall: 4000 Put Wall: 3600 |
Daily Note:
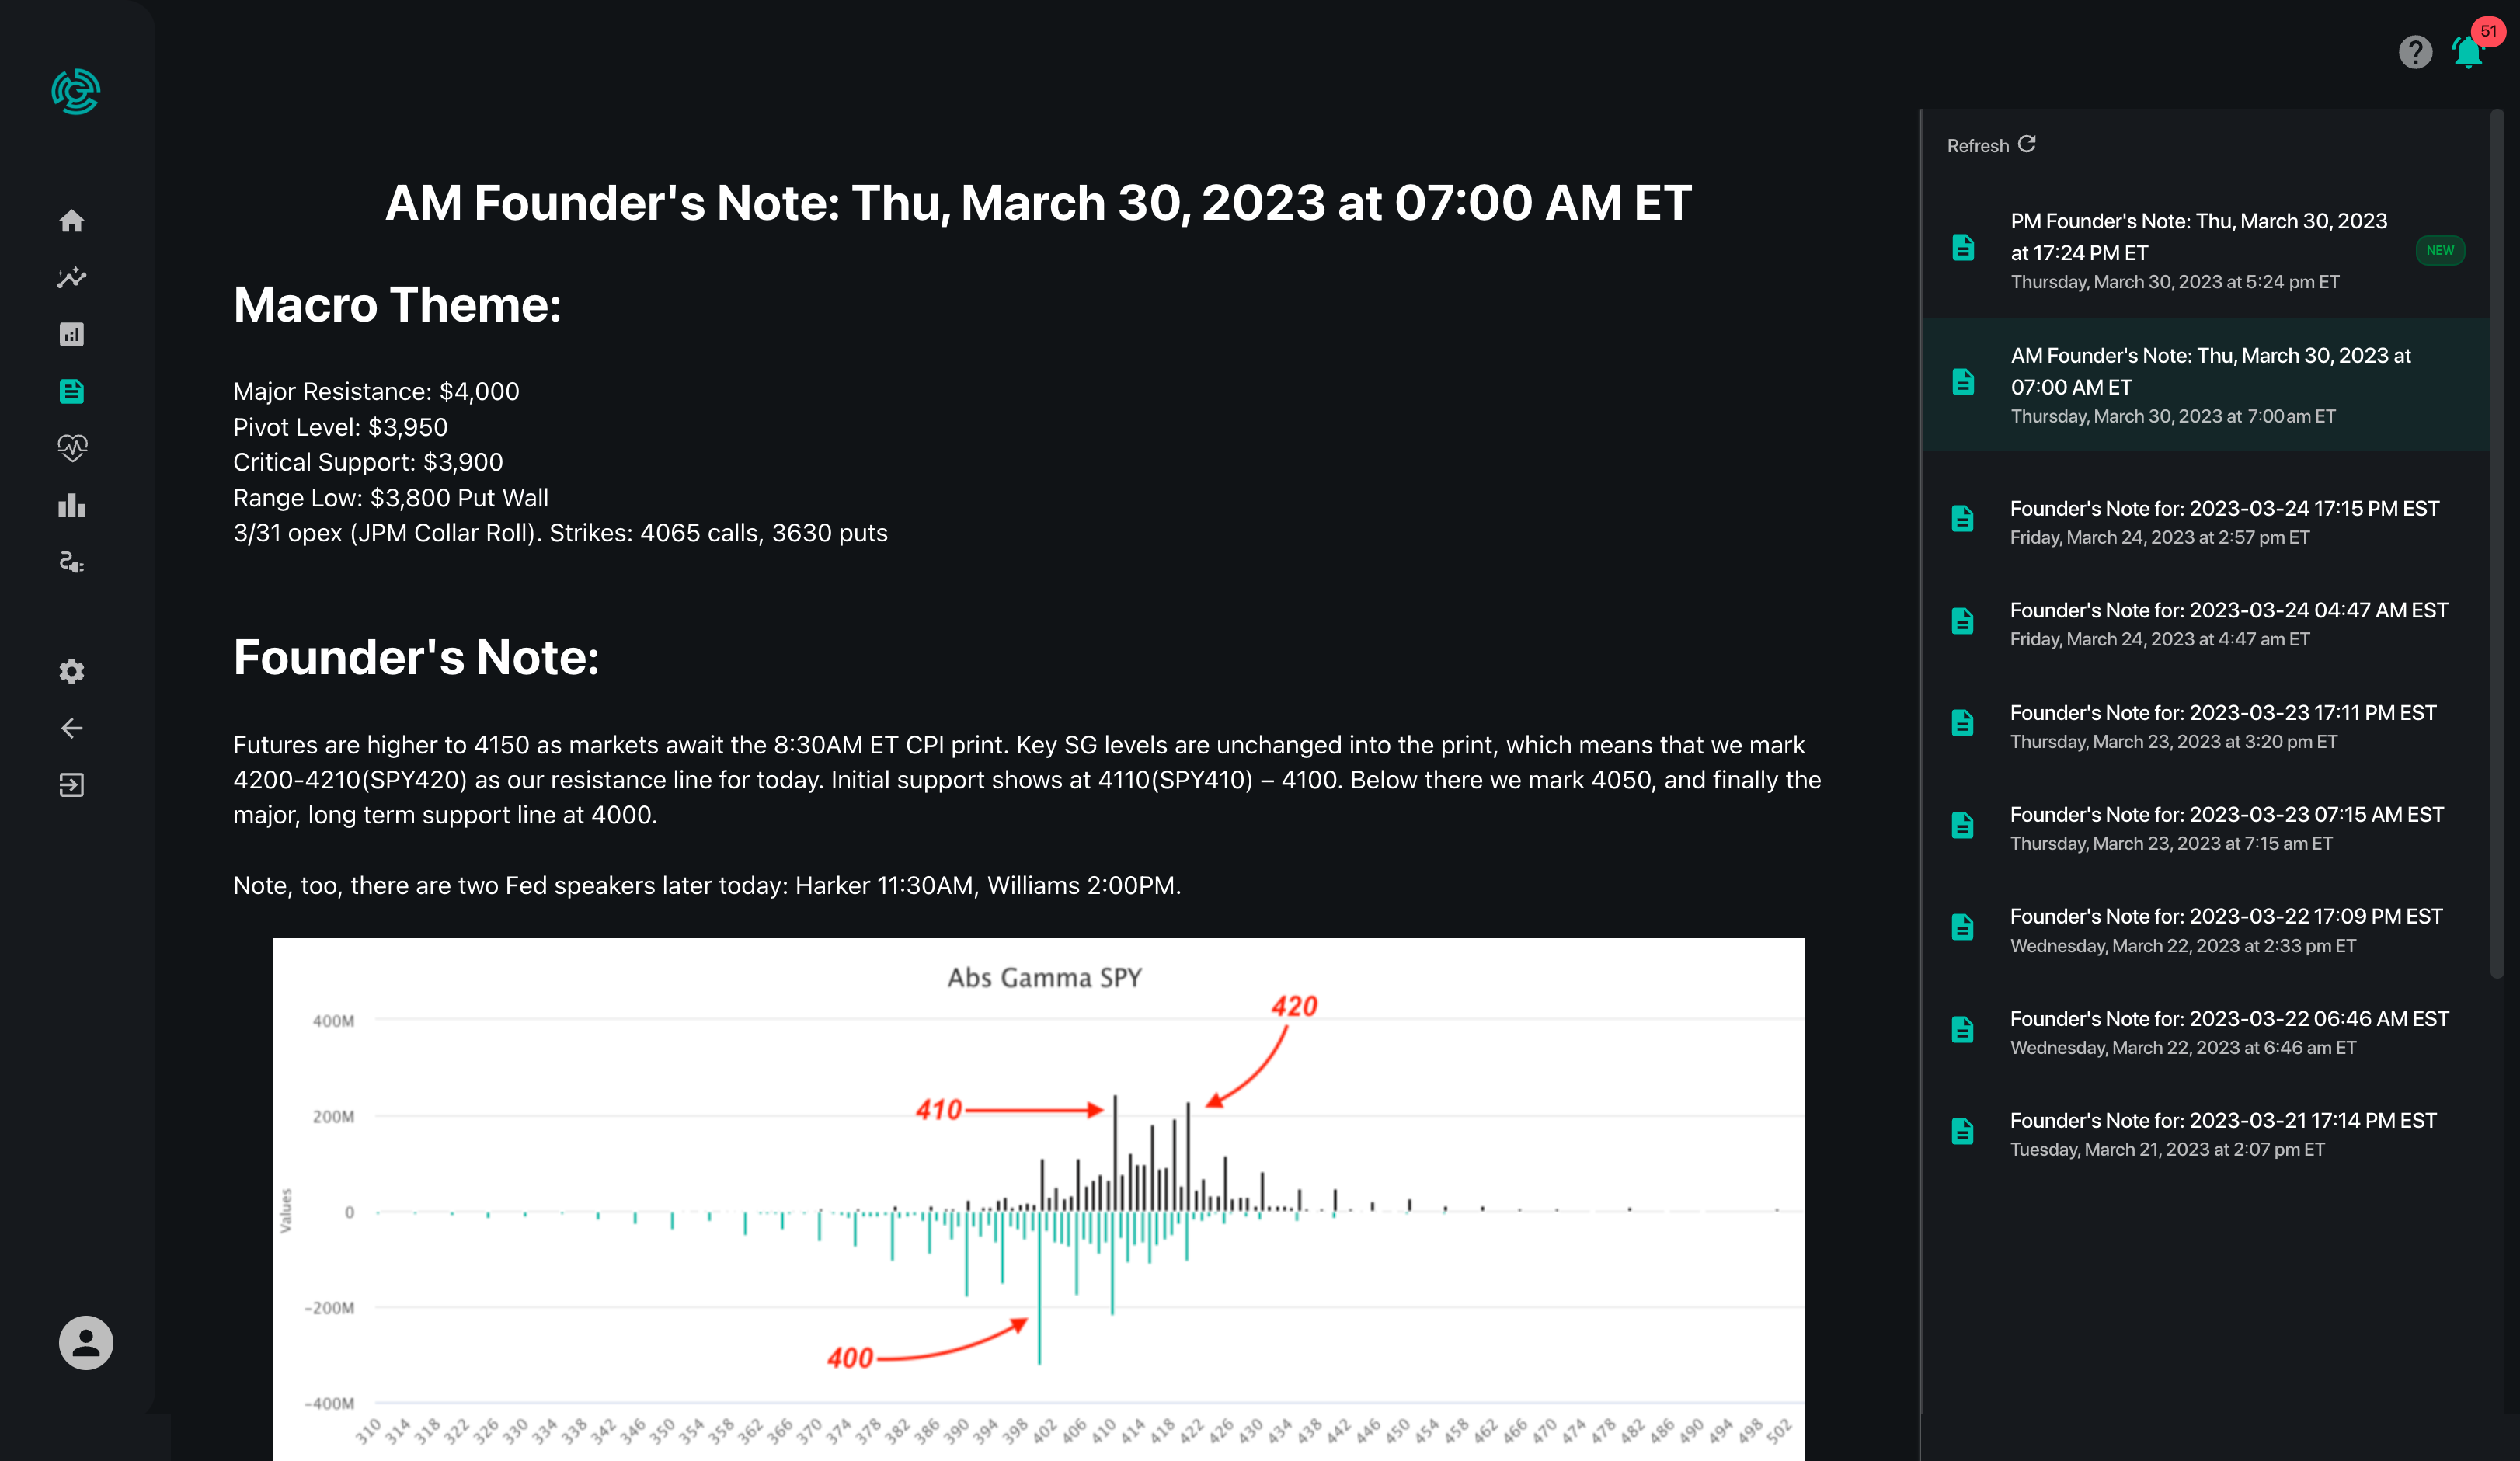
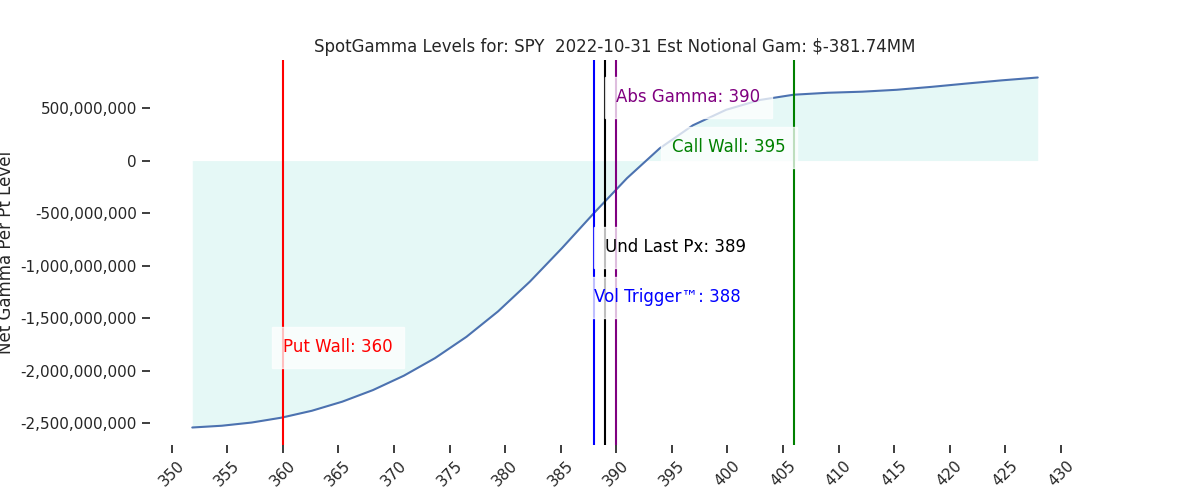
Futures have pulled back to 3885, consolidating Fridays large gains. The Call Walls jumped higher to 4000SPX and 395SPY. Accordingly we see 3950 as major resistance into Wednesdays FOMC, with another level of resistance at 3900. We see support at 3850 and 3800.
Our quick take here is that we see the market as rather overbought ahead of the FOMC and look for consolidation today, based on our view(s) that:
- Friday was over-stimulated by 0DTE flow. On Friday AM we were on the lookout for a “sucker punch” rally, and markets were given a full-on “uppercut”. Heavy 0DTE volume was once again showcased, with the largest volume strike being 100k 10/28 3900 calls. This is incredible given that the SPX opened at 3810! This 0DTE flow is pure leverage which serves to ramp the market higher.
- As anticipated, we also saw IV get crushed, particularly ultra-short-dated (read: put-fuel for a rally). This very short dated IV crush was supplemented by the idea that the Fed is going to soften its stance on Wednesday. As shown below that short dated IV is quite low now relative to Wednesdays elevated levels.
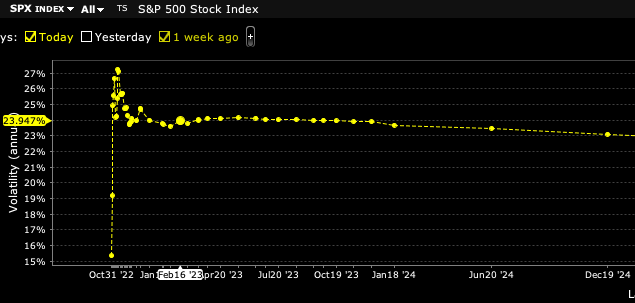
We now think the path of least resistance is <=3900 due to the buildup of positions overhead, and the lack of IV left to sell ahead of FOMC. You may recall that our other view from Friday was 3800 would remain in play into Wednesday’s FOMC, and we remain of that view.
However, it is clear that Friday did slide the options complex higher, which is something we generally read as an options market acceptance of higher equity prices. Last week the trending narrative was about “upside crash hedges” but didn’t see that in call positioning. Friday certainly seemed to spark some of that upside positioning (aside from 0DTE flow) in a way we hadn’t seen in recent rallies.
Of course, the elephant in the room is Wednesdays FOMC, which holds the fate of equities. We have no opinion on what the Fed may say – or how markets may react. We do feel that the FOMC will spark a rather large, tradable swing into November OPEX (11/18) with near term (i.e a few sessions) targets of either 4000 or 3600.
| SpotGamma Proprietary SPX Levels | Latest Data | SPX Previous | SPY | NDX | QQQ |
|---|---|---|---|---|---|
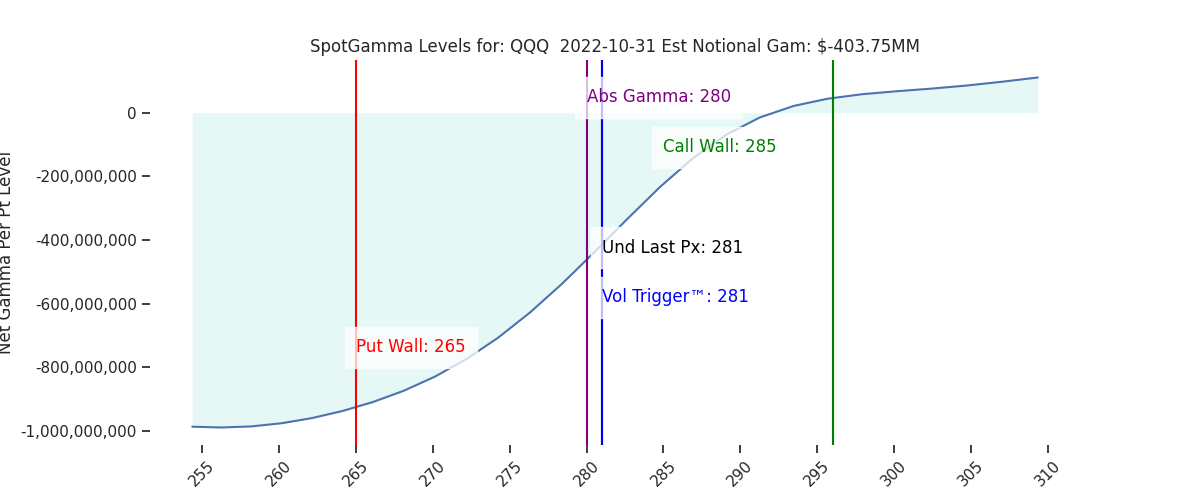
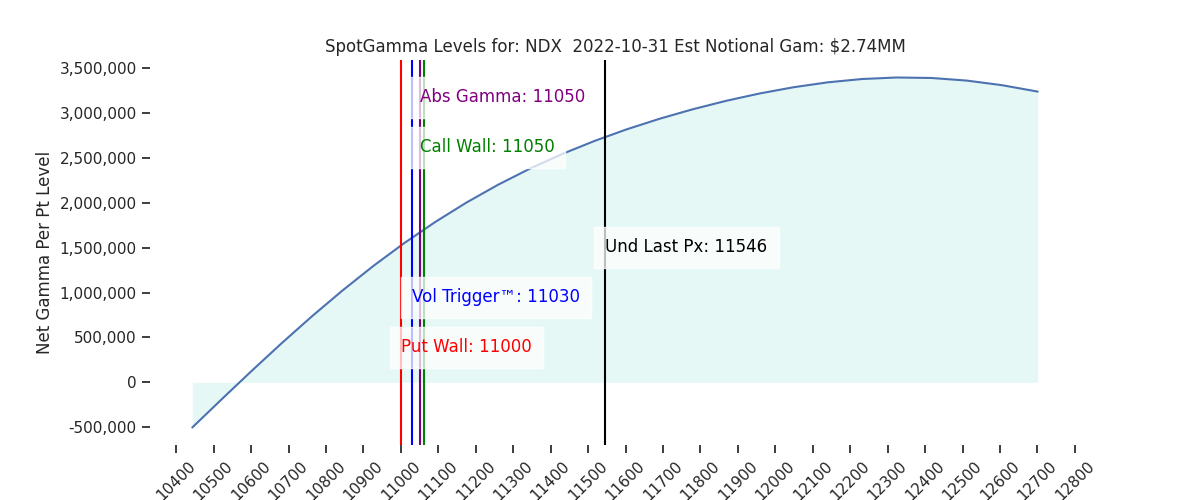
| Ref Price: | 3900 | 3902 | 389 | 11546 | 281 |
| SG Implied 1-Day Move:: | 1.2%, | (±pts): 47.0 | VIX 1 Day Impl. Move:1.64% | ||
| SG Implied 5-Day Move: | 3.15% | 3900 (Monday Ref Price) | Range: 3778.0 | 4023.0 | ||
| SpotGamma Gamma Index™: | 0.55 | 0.11 | -0.07 | 0.02 | -0.06 |
| Volatility Trigger™: | 3820 | 3750 | 388 | 11030 | 281 |
| SpotGamma Absolute Gamma Strike: | 4000 | 4000 | 390 | 11050 | 280 |
| Gamma Notional(MM): | 151.0 | 439.0 | -382.0 | 3.0 | -404.0 |
| Put Wall: | 3600 | 3600 | 360 | 11000 | 265 |
| Call Wall : | 4000 | 3800 | 395 | 11050 | 285 |
| Additional Key Levels | Latest Data | Previous | SPY | NDX | QQQ |
|---|---|---|---|---|---|
| Zero Gamma Level: | 3860 | 3804 | 391.0 | 10533.0 | 302 |
| CP Gam Tilt: | 1.17 | 1.28 | 0.86 | 1.28 | 0.73 |
| Delta Neutral Px: | 3868 | ||||
| Net Delta(MM): | $1,719,998 | $1,571,123 | $186,864 | $49,818 | $97,183 |
| 25D Risk Reversal | -0.04 | -0.09 | -0.01 | -0.01 | -0.0 |
| Call Volume | 757,101 | 471,184 | 2,105,374 | 8,459 | 686,206 |
| Put Volume | 1,048,724 | 850,936 | 3,264,720 | 9,098 | 1,240,835 |
| Call Open Interest | 6,796,235 | 6,478,415 | 7,675,892 | 60,366 | 4,553,205 |
| Put Open Interest | 11,195,543 | 11,371,724 | 13,527,294 | 55,577 | 6,794,407 |
| Key Support & Resistance Strikes: |
|---|
| SPX: [4000, 3950, 3900, 3850] |
| SPY: [400, 390, 385, 380] |
| QQQ: [285, 280, 275, 270] |
| NDX:[12500, 12000, 11500, 11050] |
| SPX Combo (strike, %ile): [(4049.0, 83.77), (3998.0, 98.37), (3963.0, 76.27), (3951.0, 98.39), (3924.0, 76.72), (3901.0, 93.85), (3834.0, 76.75), (3748.0, 76.04)] |
| SPY Combo: [394.08, 398.75, 389.02, 403.8, 382.41] |
| NDX Combo: [11050.0, 11084.0, 11292.0, 11696.0] |
| ©TenTen Capital LLC d.b.a. SpotGamma Please leave us a review: Click Here |
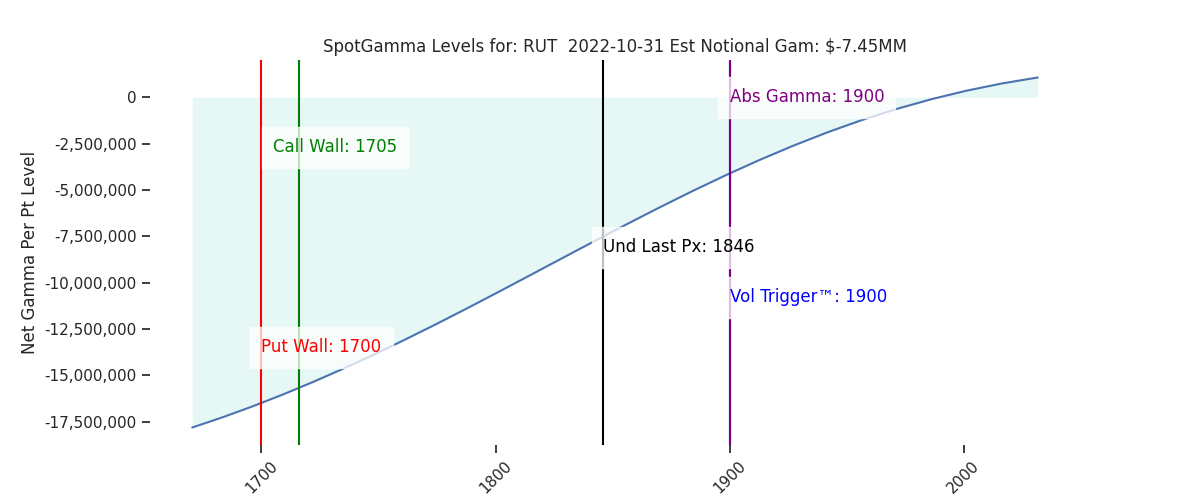
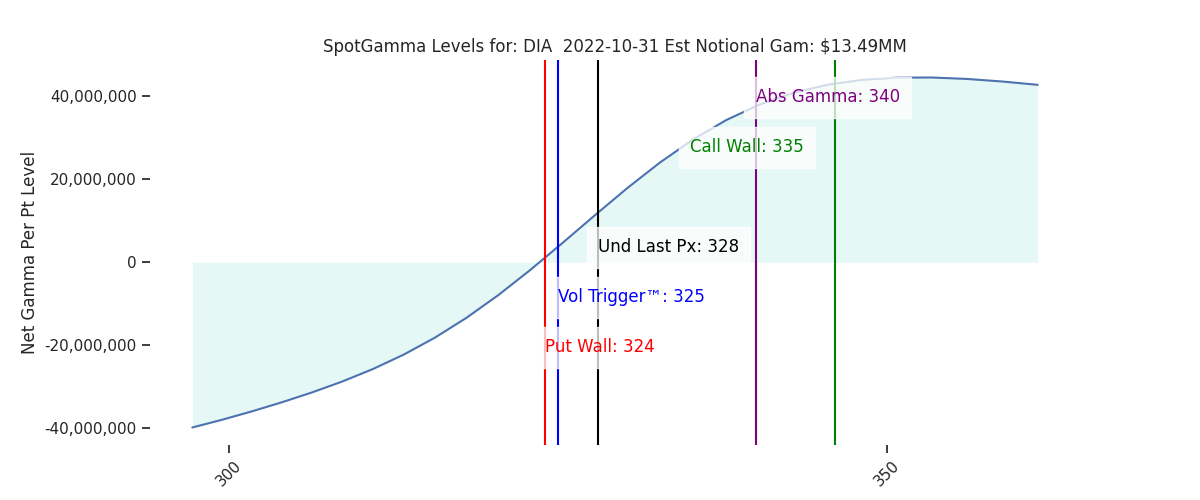
| See the FAQ for more information on reading the SpotGamma graph. |
| SpotGamma provides this information for research purposes only. It is not investment advice. SpotGamma is not qualified to provide investment advice, nor does it guarantee the accuracy of the information provided. This email is intended solely for subscribers, please do not distribute the information without the express written consent of SpotGamma.com. |