SpotGamma Beats Banks to the Forecast: Post-CPI Thrust Fails To Hold
Macro Theme: |
Key Levels: |
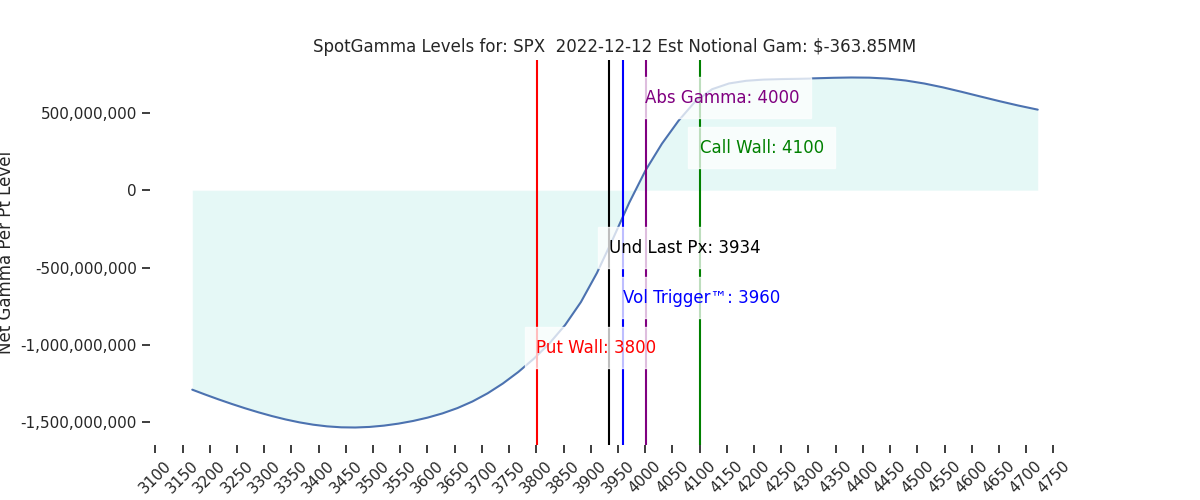
| > Major, longer term resistance is the 4100 Call Wall > Key Pivot in Dec OPEX: 4000 > Max downsize target into Dec OPEX: 3800 Put Wall > Critical Pivot dates next week: 12/13-12/14 CPI/FOMC (see 11/25 note) to 12/16 OPEX. | Ref Price: 3934 SG Implied 1-Day Move: 0.87% SG Implied 5-Day Move: 2.77% Volatility Trigger: 3960 Absolute Gamma Strike: 4000 Call Wall: 4100 Put Wall: 3800 |
Daily Note:
Futures (ESH3) are higher to 3975. Today is anticipated to be a relatively calm day, with an SG implied move of 0.87% (max move, open/close). Major resistance above remains at 4000-4010 (SPY410). Support shows at 3960(SPY395) – 3950, with 3900 major support.
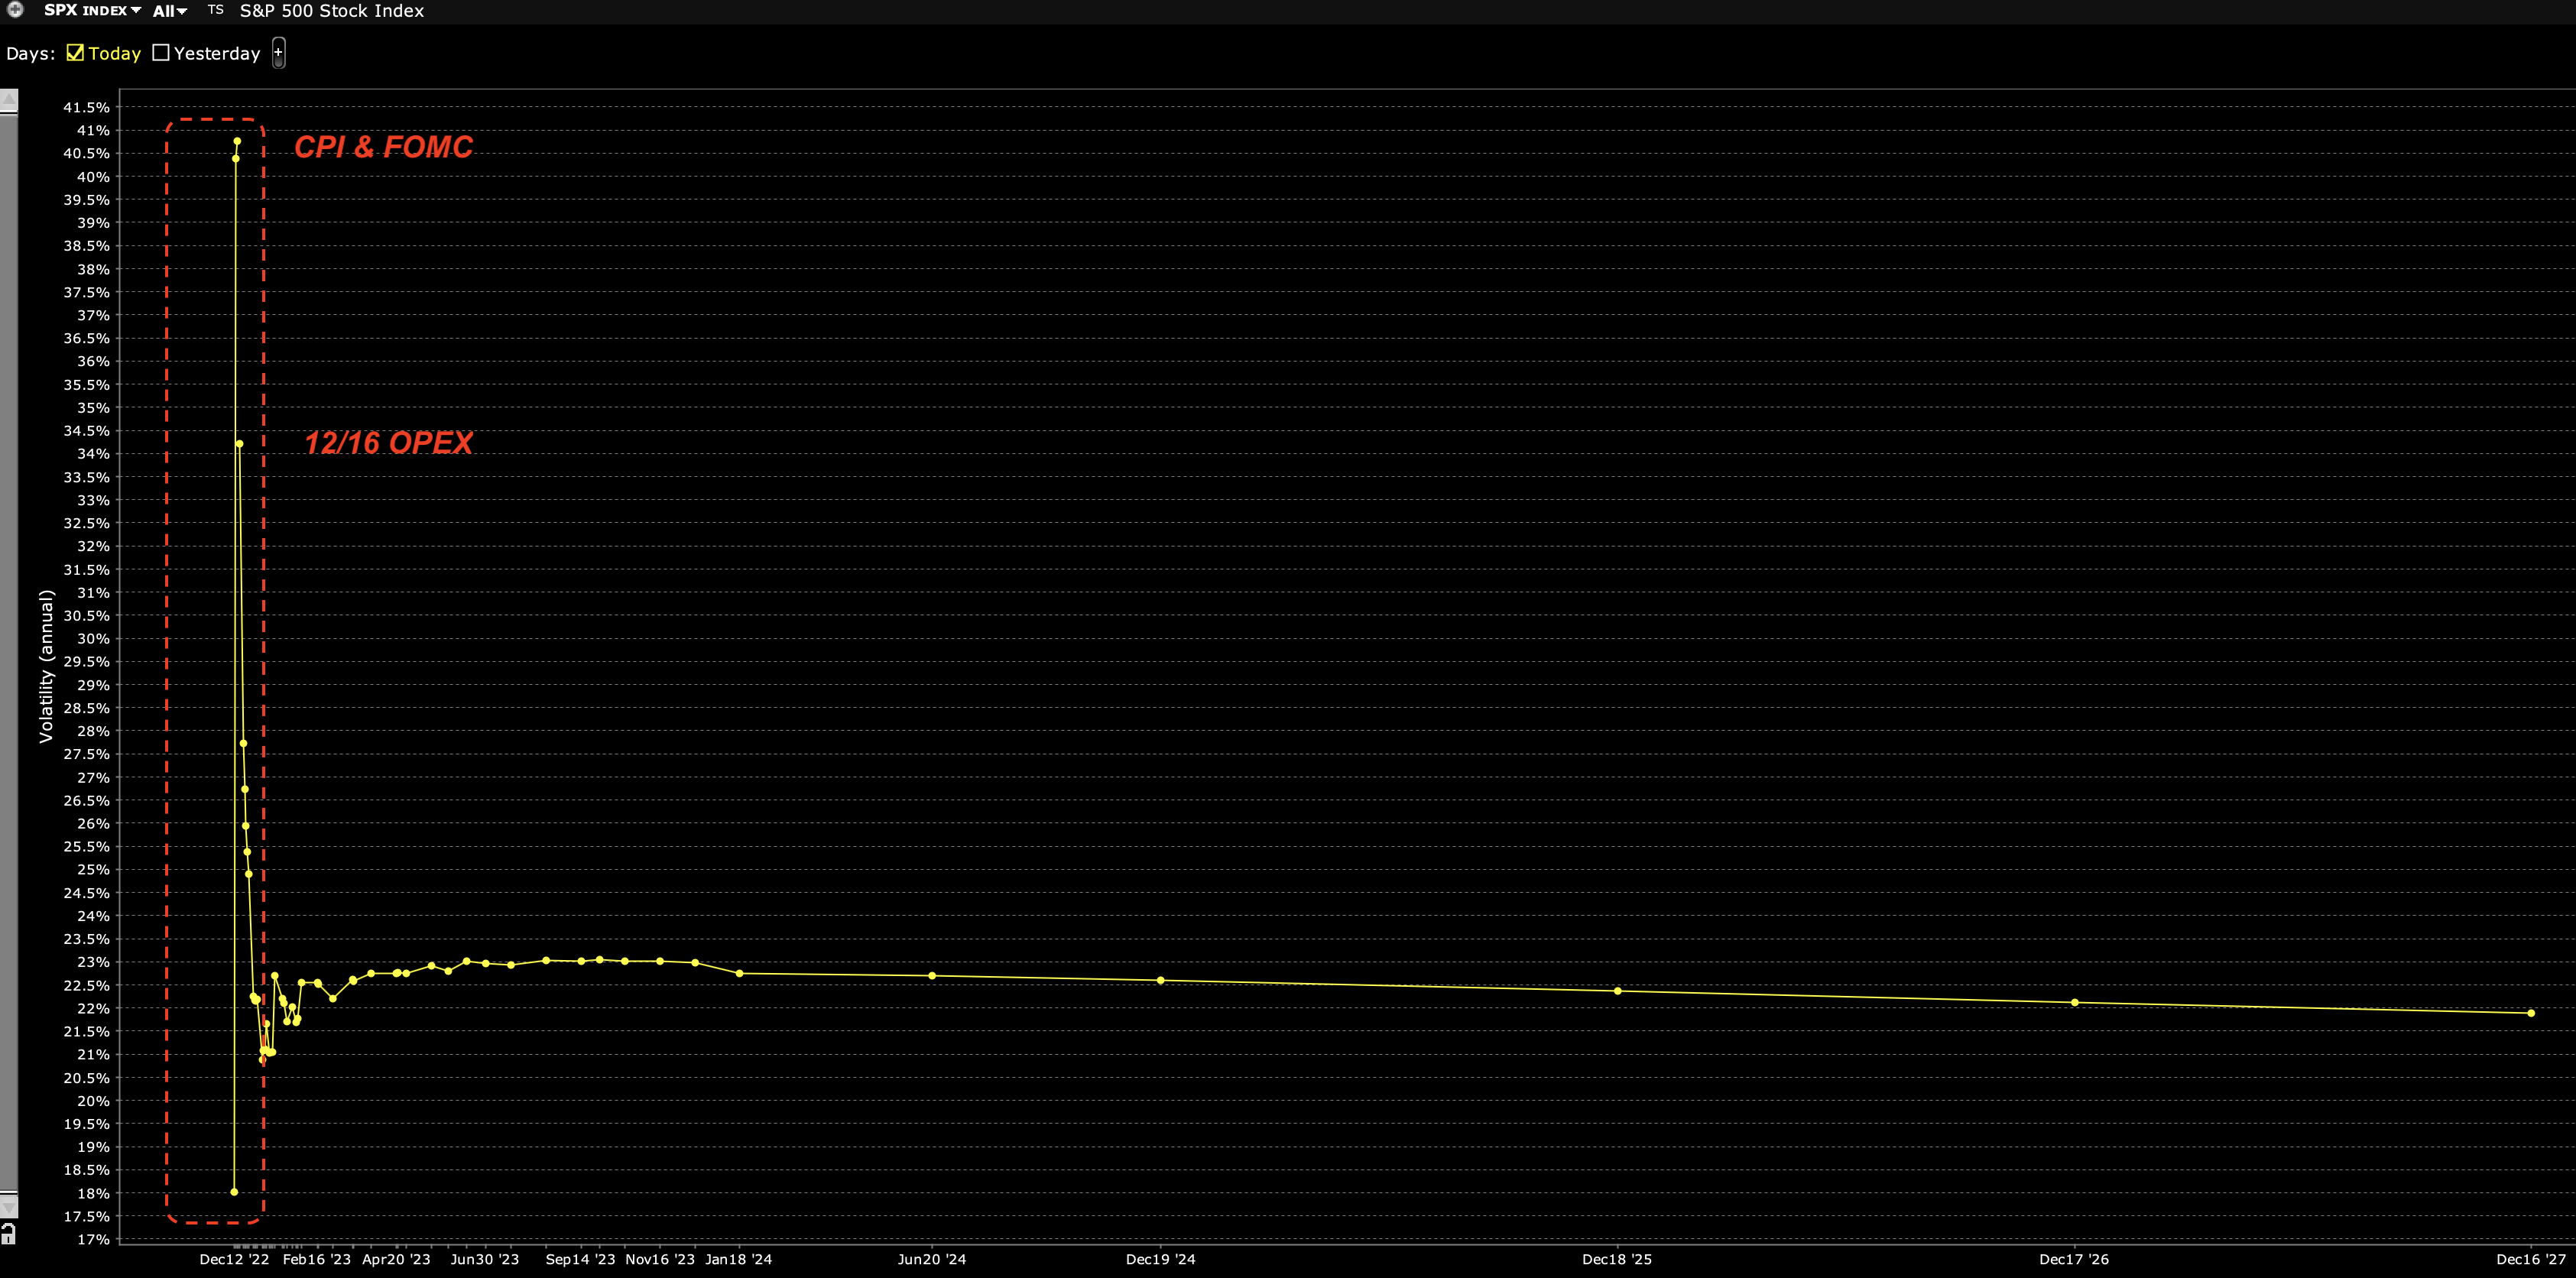
The relative calm gives way tomorrow with the 12/13 CPI print. This is then followed by the 12/14 FOMC, and 12/16 OPEX. You can see this reflected in implied volatility, wherein todays expiration IV is 17% (est. 1% move) and then IV surges to 40% for tomorrow & Wednesday (+2% est moves). This is quite high.
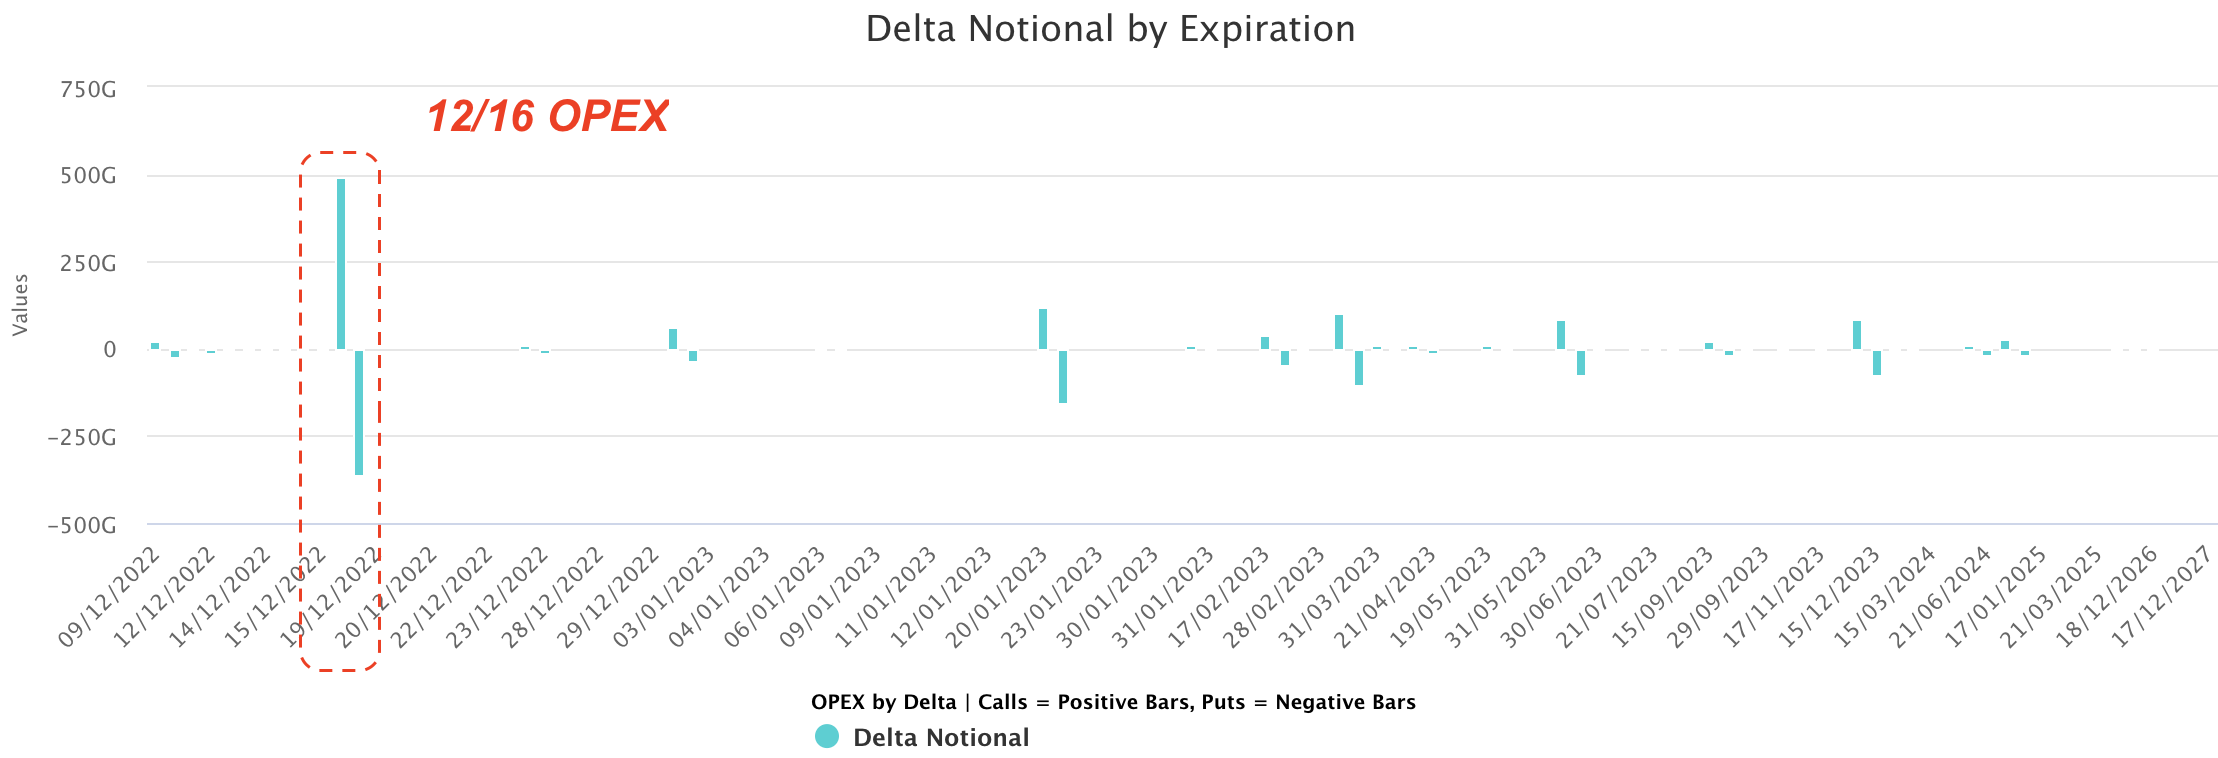
These moves will then charge (or discharge) prices into the massive Dec OPEX, wherein +$250 billion calls & puts expire across SPX/SPY/QQQ/NDX and +$300bn in single stock deltas (calls/puts each, absolute delta basis).
As you can see below this dwarfs the side of any future expiration. The value of these positions will change immensely out of FOMC, not just on directional price changes (gamma), but also coming off of those extreme IV’s shown above (vanna), and rapid time decay (charm).
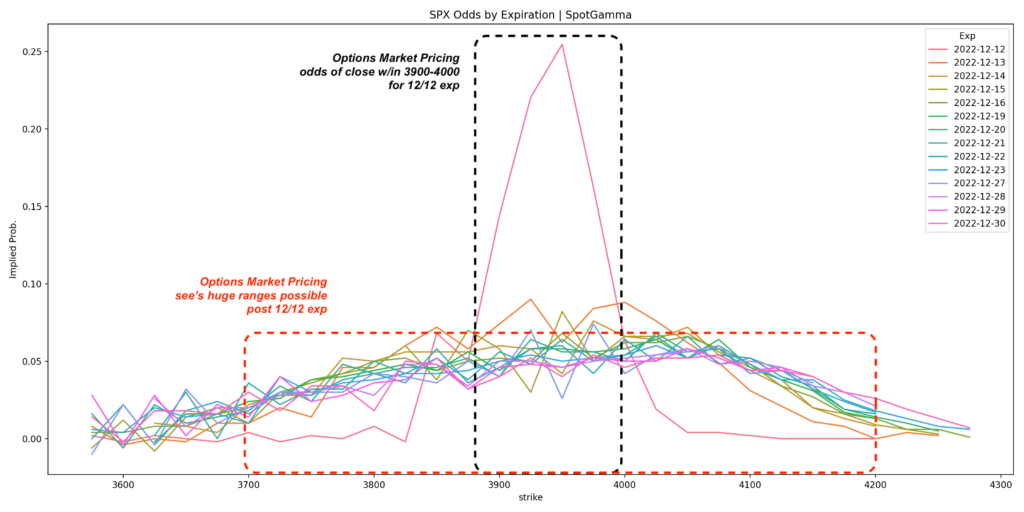
What does all this mean? Show below is the options implied probability of various closing prices across near term expirations. As you can see, the options market is today favoring a close in the 3900-4000 range we favored last week (black box). However, for all expirations past that there is very little consensus. This is seen in the fact that options traders give nearly a 5% chance of the S&P closing at any price from ~3800 to ~4100 (red box) on 12/16 expiration.
What this is telling us is that the options market does not have much directional edge implied here, but it is pricing in some extreme moves.
So where is edge unlocked for us? We think that its into Thursday & Friday wherein the giant OPEX is going to grab hold of markets and greatly influence price. Because the path of market prices over the next several days is so data dependent, it’s a guessing game to pull out a directional edge (as implied by options data above). The curveball here is that one cannot ignore markets “not doing much”.
Why? The crushing weight of expectations.
Normally we would be looking for the OPEX to reinforce price trend. Meaning, if Powell is hawkish and the market drives lower, we’d anticipate OPEX driving stock prices lower (or dovish Powell = higher stocks). However, note that 40% implied volatility figure we noted at the top – that is massive. This tells us that expectations for CPI & FOMC volatility are huge.
One could argue that in order to full-fill these expectations we need “shock & awe” out of Powell. The issue with this is that options have “extreme” IV, but what if we only get “large” price moves (not extreme price moves)? Then suddenly those really expensive options come for sale – which could crush volatility.
Said more simply, volatility generally comes when expectations are exceeded. Expectations are currently very high – and for good reason. However, if Powell fails to deliver policy that exceeds those elevated expectations then the elevated 12/16 exp options get crushed in value, which could end up supressing market movements.
| SpotGamma Proprietary SPX Levels | Latest Data | SPX Previous | SPY | NDX | QQQ |
|---|---|---|---|---|---|
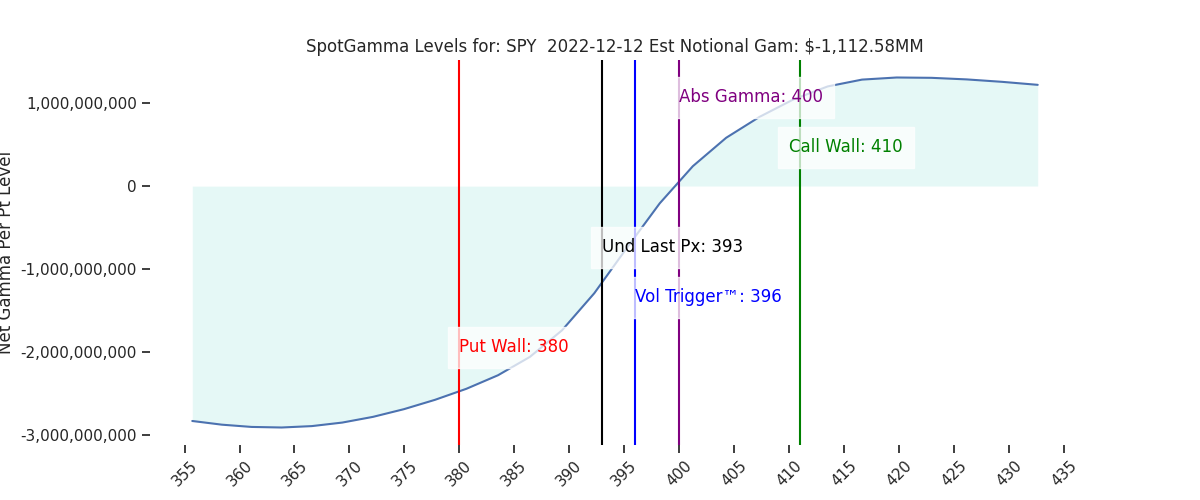
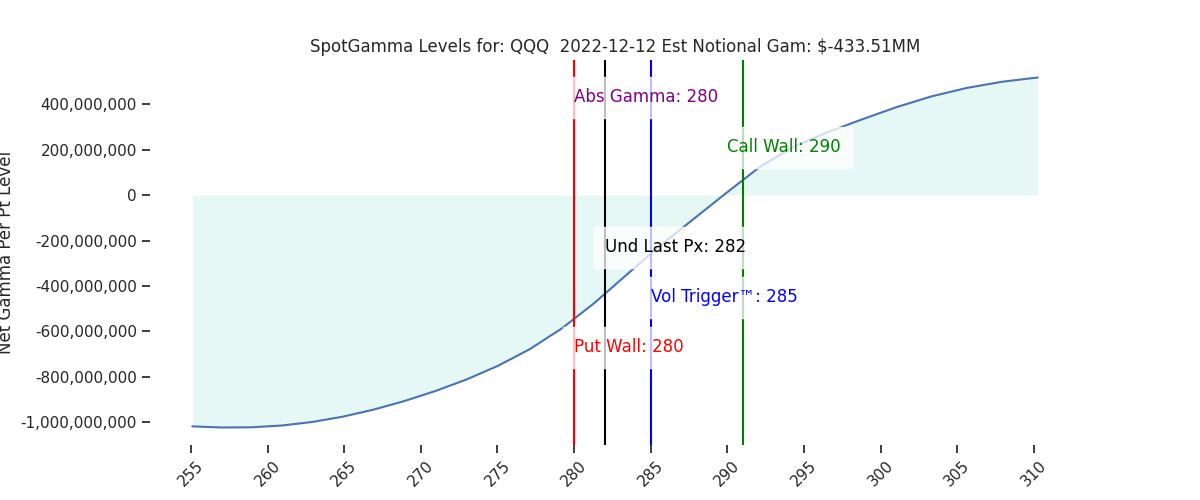
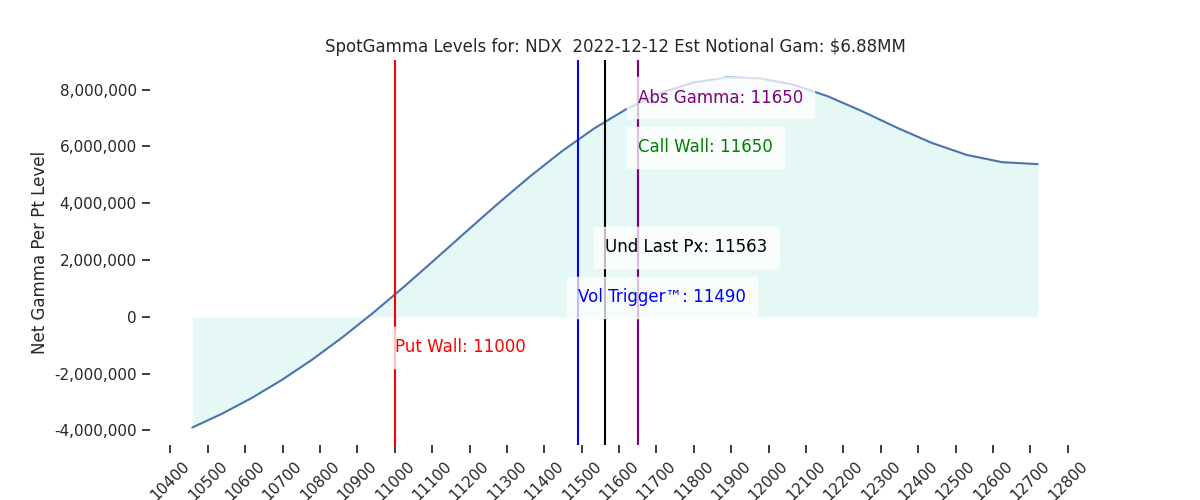
| Ref Price: | 3934 | 3960 | 393 | 11563 | 282 |
| SG Implied 1-Day Move:: | 0.87%, | (±pts): 34.0 | VIX 1 Day Impl. Move:1.44% | ||
| SG Implied 5-Day Move: | 2.77% | 3934 (Monday Ref Price) | Range: 3825.0 | 4043.0 | ||
| SpotGamma Gamma Index™: | -0.56 | -0.16 | -0.23 | 0.05 | -0.06 |
| Volatility Trigger™: | 3960 | 3985 | 396 | 11490 | 285 |
| SpotGamma Absolute Gamma Strike: | 4000 | 4000 | 400 | 11650 | 280 |
| Gamma Notional(MM): | -364.0 | -251.0 | -1113.0 | 7.0 | -434.0 |
| Put Wall: | 3800 | 3900 | 380 | 11000 | 280 |
| Call Wall : | 4100 | 4100 | 410 | 11650 | 290 |
| Additional Key Levels | Latest Data | Previous | SPY | NDX | QQQ |
|---|---|---|---|---|---|
| Zero Gamma Level: | 3983 | 3971 | 398.0 | 10872.0 | 300 |
| CP Gam Tilt: | 0.88 | 0.9 | 0.72 | 1.47 | 0.76 |
| Delta Neutral Px: | 3931 | ||||
| Net Delta(MM): | $1,928,461 | $1,918,313 | $201,123 | $59,083 | $101,667 |
| 25D Risk Reversal | -0.05 | -0.05 | -0.05 | -0.04 | -0.05 |
| Call Volume | 455,483 | 436,147 | 1,530,072 | 5,652 | 646,712 |
| Put Volume | 880,404 | 648,108 | 2,076,684 | 6,498 | 928,977 |
| Call Open Interest | 7,002,713 | 7,010,457 | 8,374,665 | 75,108 | 5,427,767 |
| Put Open Interest | 12,258,561 | 12,302,725 | 13,865,198 | 71,405 | 7,204,949 |
| Key Support & Resistance Strikes: |
|---|
| SPX: [4000, 3950, 3900, 3800] |
| SPY: [400, 395, 390, 380] |
| QQQ: [300, 290, 285, 280] |
| NDX:[12000, 11750, 11650, 11500] |
| SPX Combo (strike, %ile): [(4123.0, 74.38), (4100.0, 92.73), (4076.0, 78.57), (4048.0, 87.28), (3926.0, 77.27), (3899.0, 94.16), (3891.0, 76.06), (3875.0, 81.57), (3852.0, 93.97), (3836.0, 85.89), (3824.0, 80.67), (3801.0, 97.3), (3773.0, 79.63), (3753.0, 75.73), (3749.0, 89.94)] |
| SPY Combo: [379.91, 389.74, 385.02, 409.8, 374.8] |
| NDX Combo: [11644.0, 11482.0, 11066.0, 11274.0, 11887.0] |
| ©TenTen Capital LLC d.b.a. SpotGamma Please leave us a review: Click Here |
| See the FAQ for more information on reading the SpotGamma graph. |
| SpotGamma provides this information for research purposes only. It is not investment advice. SpotGamma is not qualified to provide investment advice, nor does it guarantee the accuracy of the information provided. This email is intended solely for subscribers, please do not distribute the information without the express written consent of SpotGamma.com. |

