S&P 500 Stock Market Gamma Trading Levels Based on Options Open Interest
FOR OPTIONS, FUTURES, AND EQUITY TRADERS
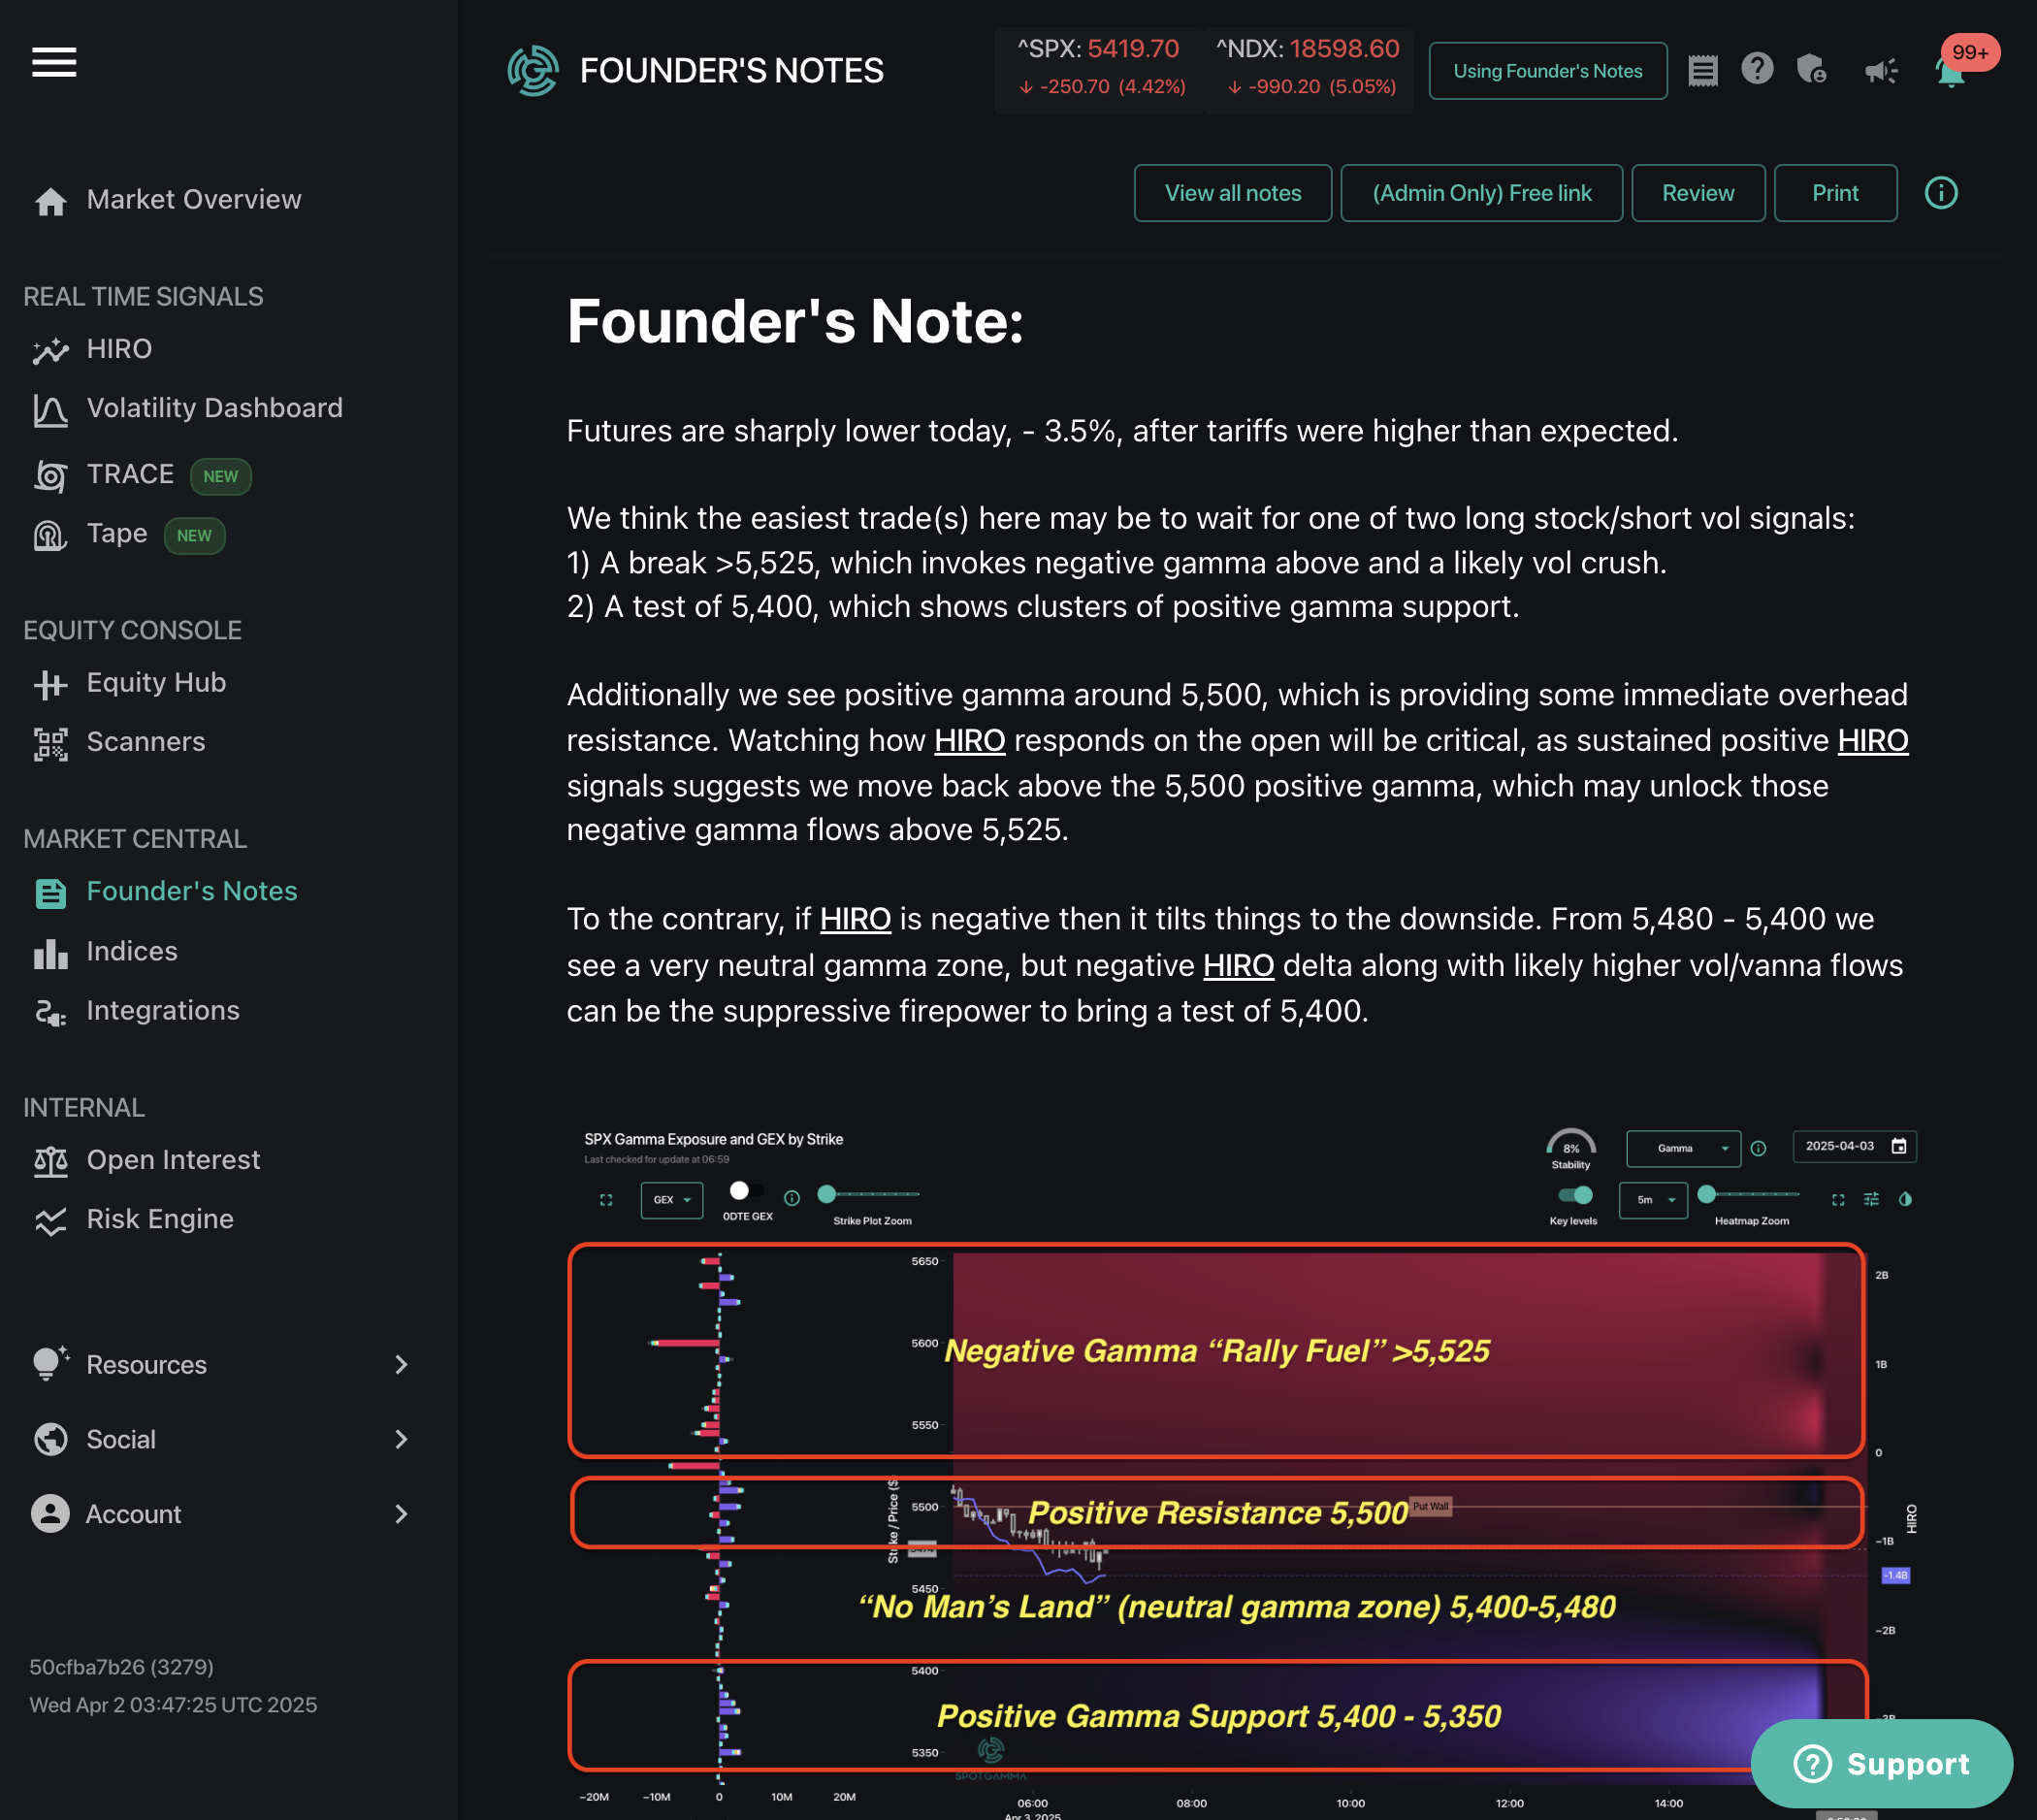
See Options Pressure — In Real Time
HIRO turns millions of options trades into one clear indicator of dealer hedging pressure — so you can see how options pressure moves price, across 400+ US stocks, ETFs, and indices.
as seen in






See Options Trades Flexing on the Market - In Real Time
“HIRO is the best tool I've found since I started trading 6 years ago.”
— merit a., SpotGamma alpha Subscriber
“HIRO is MY HERO? but seriously, if real-time options data matters to you (and it should) then hiro is a must. ”
— brock l., SpotGamma alpha Subscriber
Traders Use HIRO To Stop Guessing
HIRO shows you how real-time dealer hedging drives today’s markets, providing the clarity you need to trade with confidence. Understand immediately how options dealers create buying and selling pressure in the names you trade.
HIRO (Hedging Impact of Real-time Options) pulls back the curtain on the live hedging behavior that influences price action for stocks, ETFs, and indices — distilling millions of data points into simple visuals.
What’s Included in HIRO?
Component
What It Shows
How It Supports Your Trading
HIRO Indicator
The net direction and size of dealer hedging pressure for a stock, ETF, or index, updated in real time
See the real-time impact of hedging pressure before you commit to a trade
Data Cuts
Data can be broken out across Puts vs. Calls, or specifically focused on the nearest expiry
Pinpoint which side of the market is actually driving the move, and isolate the impact of short vs. long-duration options.
Technical Indicators
Bollinger Bands, moving averages, RSI, MACD, and more can be applied to either price or the HIRO Indicator on the chart
Confirm your trades with technical indicators to better understand the impact of movement in the HIRO indicator and underlying price.
Charting Package
Candle type (line, candle, or OHLC), candle duration, extended hours, and axis settings can be customized on your chart
Adjust the chart to match your trading style, from scalping short intervals to reviewing multiple days at a glance
Flow Alerts
Visual highlight on the chart the moment meaningful options activity occurs for the stock
Know when options flow is significant enough to drive price movement, so you can avoid reacting to every tick.
Key Levels
SpotGamma’s Call Wall, Put Wall, Hedge Wall, and Absolute Gamma Strike overlaid directly on the HIRO chart
See where hedging pressure is likely to meet resistance or support, so you can place or size your trades around those levels
Flow Data (Tape)
Live feed of the individual options trades — strike, expiration, size, and premium — driving the HIRO move
Validate a move in HIRO by understanding the size and conviction behind each trade.
How Top Traders Use HIRO
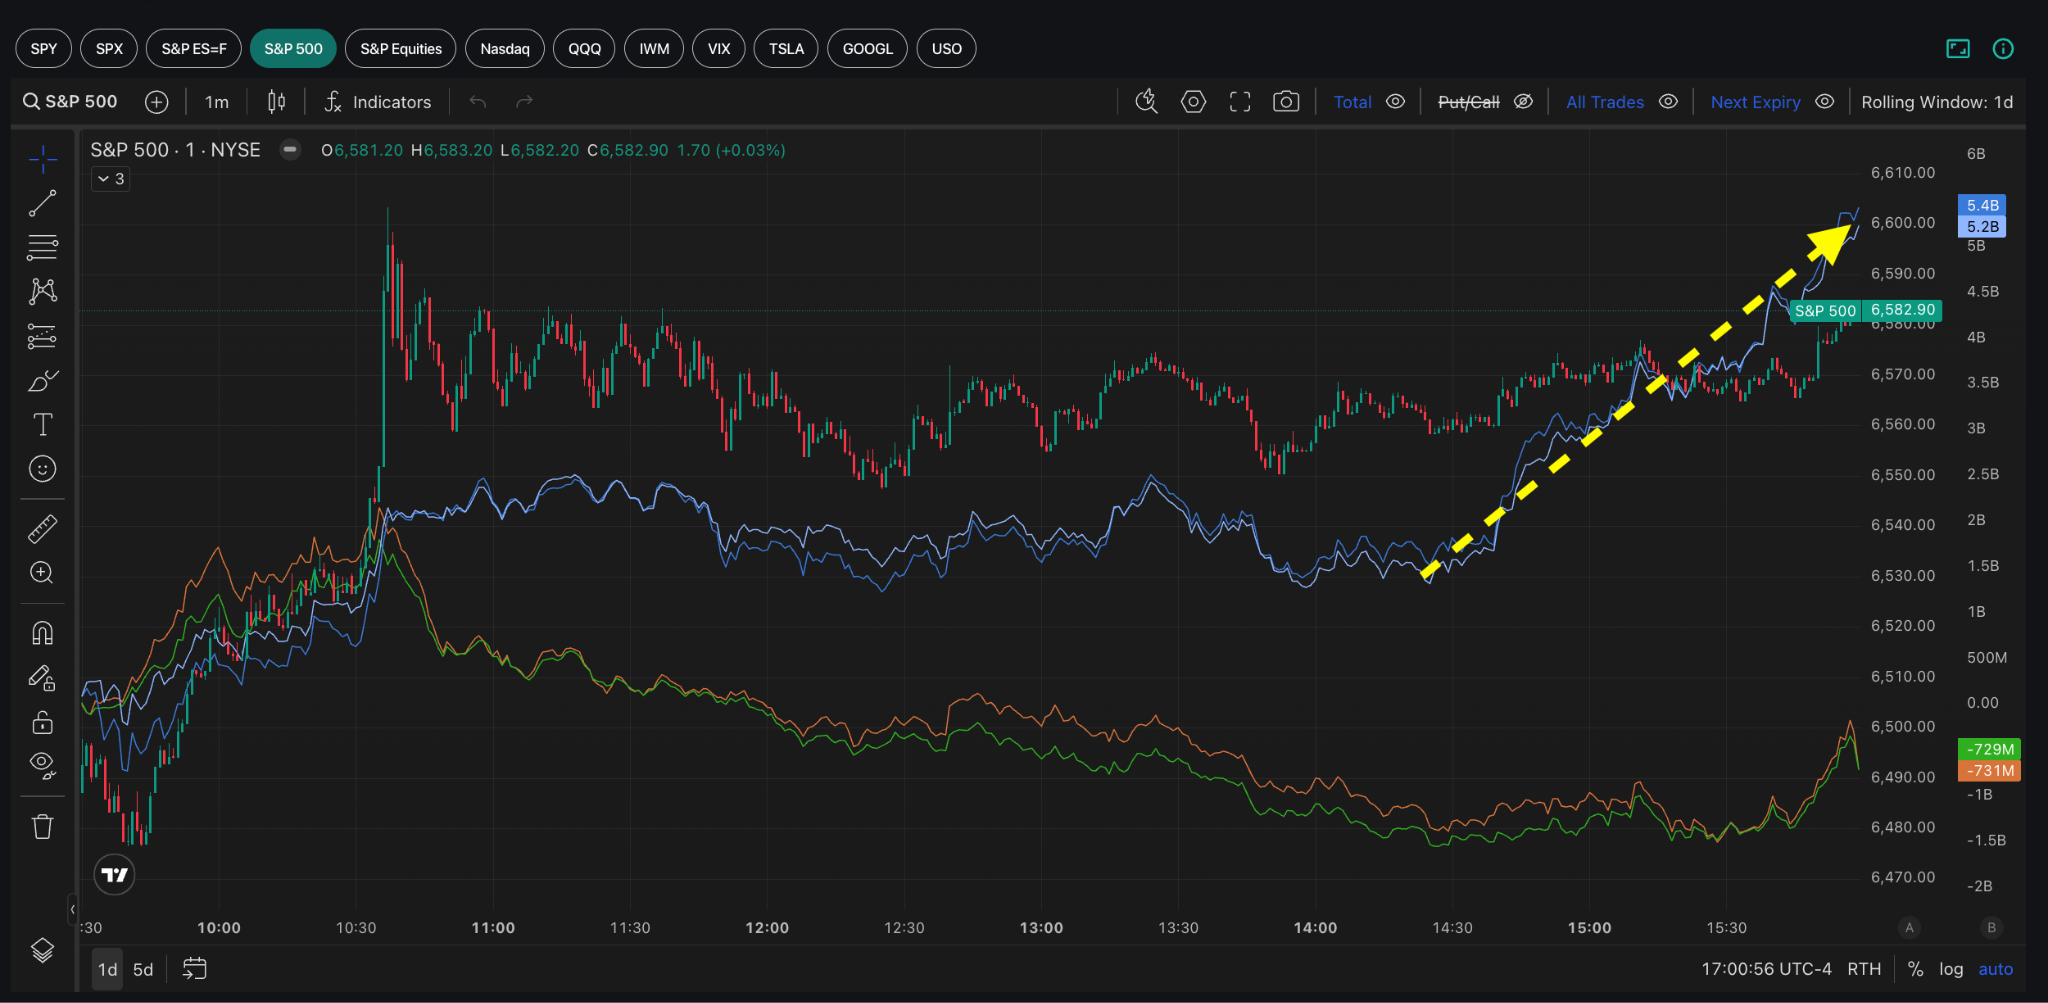
HIRO Flow Alerts fire when significant options activity occurs for the selected stock. Watch for the HIRO line to flatten after a Flow Alert — that typically indicates options pressure has become exhausted, which can precede price reversals.
Overlay the Call Wall, Put Wall, and Hedge Wall directly on the HIRO chart. When price approaches one of these key levels, look for HIRO to flatten or reverse — often indicating that options pressure is losing momentum.
Look for situations where price and HIRO begin to move opposite directions — that divergence can indicate a pending reversal. For added granularity, HIRO allows you to apply moving averages, Bollinger Bands, and other technical indicators to better understand the dynamics between HIRO and price.
How HIRO Works Alongside SpotGamma’s Many Tools
The HIRO indicator is designed to work alongside other tools within the SpotGamma platform. You can combine HIRO with support & resistance levels, live flow data, or the TRACE heatmap to surface high conviction setups.
Using HIRO with Key Levels
Key levels — such as the Call Wall, Put Wall, and Hedge Wall — indicate strikes associated with support, resistance, and volatility. You can view how HIRO behaves as price approaches these levels to understand if dealer hedging pressure is likely to change direction or stall out.
Using HIRO alongside Tape
HIRO tracks the real-time hedging impact of options activity on the underlying stock, while Tape shows the specific trades behind that directional pressure. Flow data from Tape can be viewed directly below the HIRO chart, revealing the specific trades that are driving directional hedging pressure.

Using HIRO within TRACE
TRACE displays a heatmap of buying and selling pressure for the S&P 500. Within TRACE, you can toggle on the HIRO indicator for a holistic understanding of how options are impacting the market right now — and how that impact is likely to change across price and time.
SpotGamma Alpha:
Institutional Precision For Today's Trader
$299/mo
join spotgamma
Unlock HIRO with Alpha
HIRO reveals the real-time impact of options hedging pressure on the underlying stock, allowing you to trade with conviction.
HIRO can be unlocked with a SpotGamma Alpha subscription — subscribe today for instant access to HIRO, alongside SpotGamma’s TRACE, twice daily Founder’s Note, Synthetic Open Interest model, and an engaged community with thousands of traders.
spotgamma alpha
Subscribe now to get instant access.
HIRO FAQ
What is SpotGamma’s HIRO Indicator?
Every time an option trades, the dealer on the other side of that trade has to buy or sell the underlying stock to stay hedged. HIRO tracks that hedging activity in real time, translating millions of data points into a single, easy-to-read indicator of options hedging pressure. For deeper mechanics, HIRO works by aggregating the delta notional value of every options trade across 400+ US stocks, ETFs, and indices, showing you when and how options activity is likely driving price.
What does a rising or falling HIRO line mean?
A rising HIRO line means dealers are buying the underlying stock to hedge, creating upward pressure for the underlying instrument. A falling line means dealers are selling, which creates downward pressure for the selected instrument. This pattern holds true whether you're viewing the total HIRO line or the separate Put and Call lines.
How does SpotGamma’s HIRO Indicator work alongside Key Levels?
Key Levels (the Call Wall, Put Wall, and Hedge Wall) show you where dealer hedging is likely to create areas of support, resistance, or volatility. These levels are based on SpotGamma’s Total Open Interest model. HIRO shows you the impact right now — the live pressure from options trading as it occurs. Traders can easily use both together by turning on the Key Levels toggle within the HIRO chart. When price approaches these key levels, HIRO flow can stall, reverse, or accelerate, giving an indication of how price action could shift.
What is a HIRO Flow Alert?
Within HIRO, a Flow Alert fires when options activity for a given ticker crosses a threshold significant enough to likely move the stock. This functions as a “watch now” cue for traders. When flow shuts off following a flow alert, SpotGamma analysis shows that the stock price tends to stall out or reverse.
Can I break out the impact of Puts and Calls separately within the HIRO Indicator?
Yes, the Put/Call toggle splits the single HIRO line into two. When split out, the orange candlesticks show the hedging impact of call activity, while the blue candlesticks show the impact of put activity.
What's the difference between "All Trades" and "Next Expiry"?
In HIRO, "All Trades" captures the projected hedging impact across the full options complex for a ticker. The "Next Expiry" toggle isolates the impact of the nearest-expiry options — which could be same-day or next Friday expirations, depending on the selected instrument. Near expiry options tend to carry more immediate hedging impact, but they also bring less staying power.
Which instruments does the HIRO indicator cover?
HIRO covers 400+ of the most actively traded US stocks, ETFs, and indices, plus “basket” instruments. The S&P 500 basket combines SPX, SPY, /ES, and XSP into one line; S&P Equities combines all underlying S&P components; Mag7 combines AAPL, AMZN, GOOGL, META, MSFT, NVDA, and TSLA.
Who has access to HIRO?
HIRO is included with a SpotGamma Alpha subscription.