• Skip to main content
  • Skip to primary sidebar

SpotGamma™

S&P 500 Stock Market Gamma Trading Levels Based on Options Open Interest

  • About
  • Pricing
  • Academy
  • Resources
    • Tool Demos
    • Case Studies
    • Blog
    • Support Center
    • Daily Report
    • Free Trading Tools
      • Opening Setup Free Report
      • Options Profit Calculator
      • SPX Gamma Exposure
      • Implied Earnings Moves
    • Free Training
    • Report Card
  • Login

Mar 26 2022

Identifying Opportunities with HIRO

Trader Doug Pless recently played a common setup we see in the HIRO data. HIRO can be quite valuable in helping traders identify a turn in trend, not only on declines but also on strong rallies.

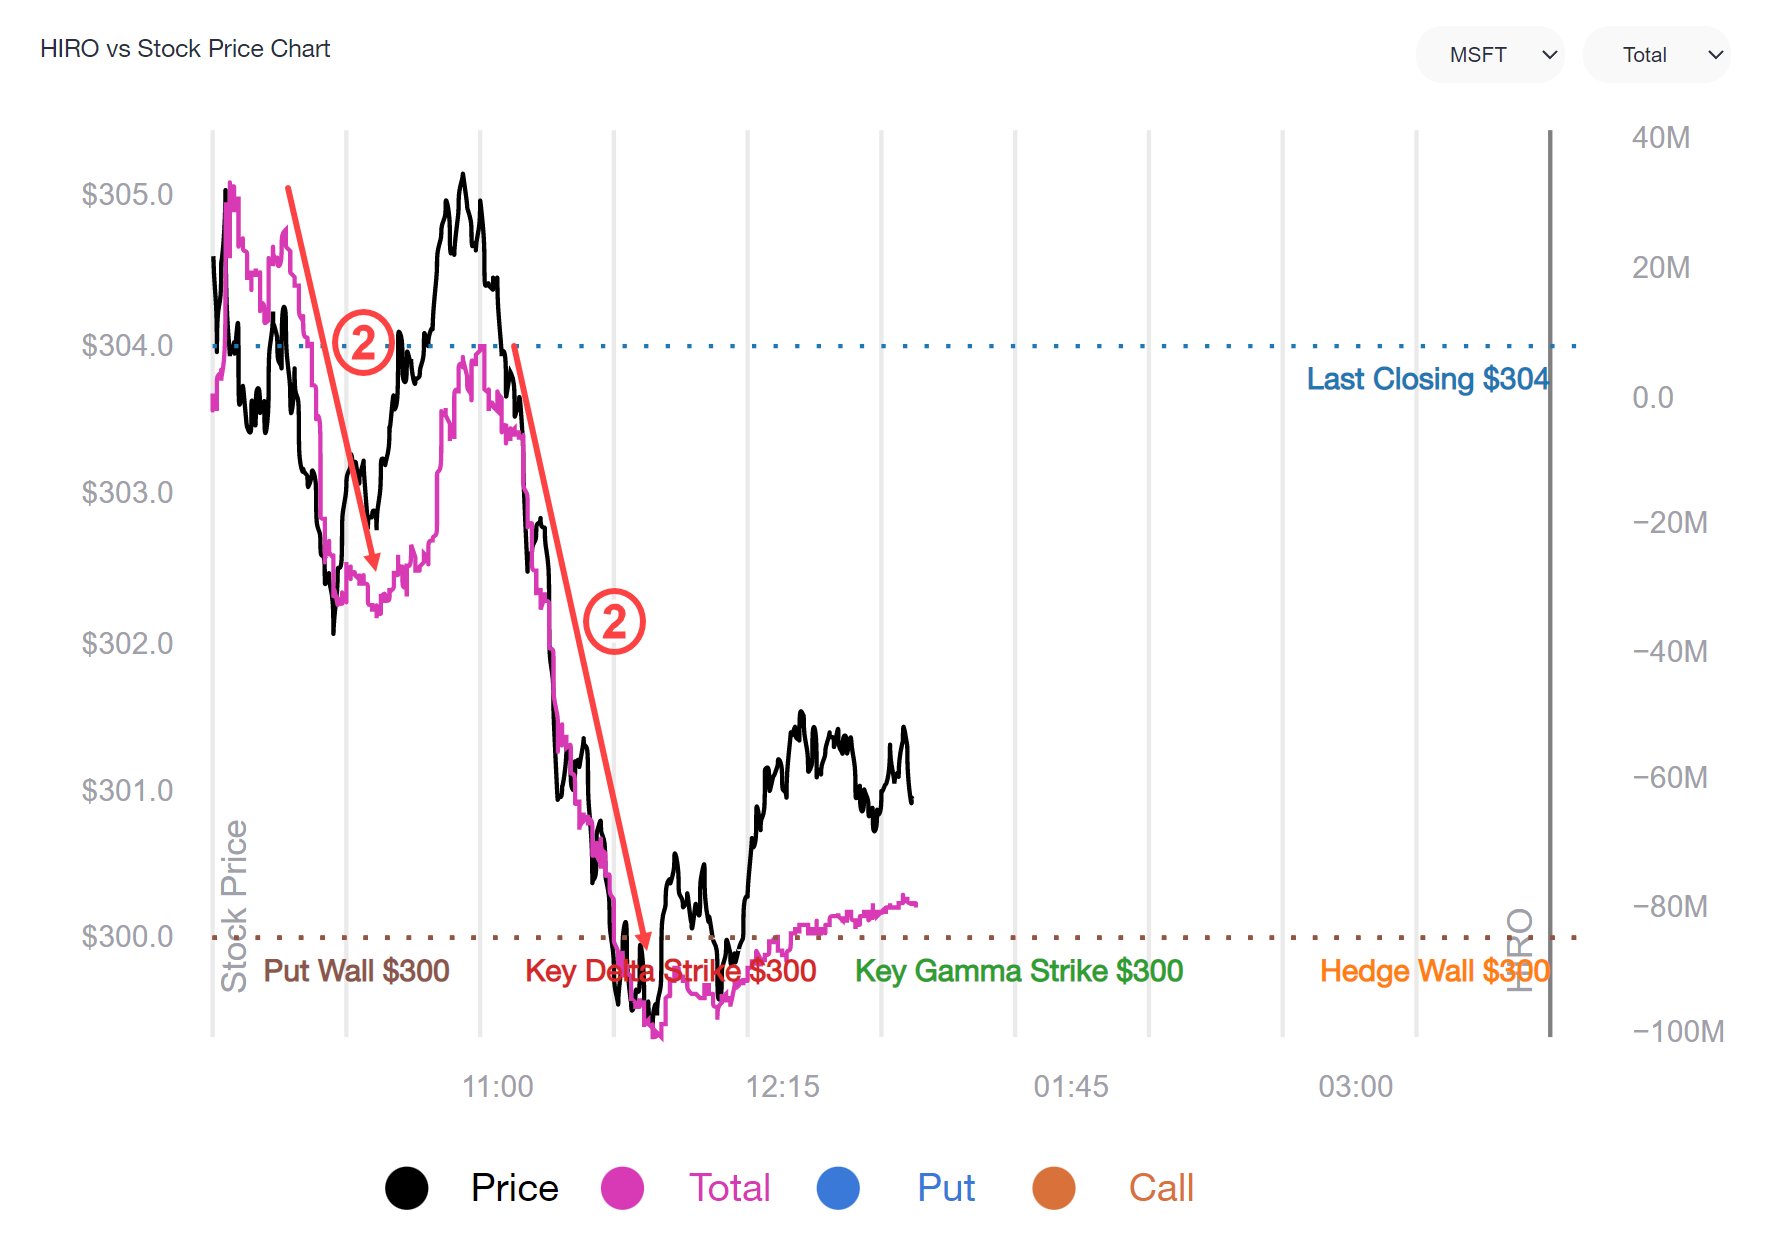
Below is a chart of MSFT from Friday, and you can see that the stock (black line) traded sharply lower down in to the $300 strike. You’ll note at 300 there are several labels, which key support levels derived from our Equity Hub data.

As the stock sells of into that level, there is an interesting divergence in the HIRO data (purple line). If the HIRO line is trending lower, as labeled with the red “2” arrows, that is indicating traders are either selling calls or buying puts. This may lead options market makers to short MSFT stock.

When the HIRO line shifts sideways, or turns higher, that indicates that the call selling and/or put buying has stopped. Its at those point(s) that we see the stock mean revert.
Image

Share This Article

  • Share
  • Twitter
  • LinkedIn
  • Reddit
  • Facebook

Written by SpotGamma · Categorized: HIRO, Market Analysis · Tagged: HIRO, MSFT

Don’t have an account with SpotGamma?

Choose the plan you want today to view unique support and resistance levels, access Founder’s Notes and expert commentary, daily trading ranges, and entrance into our private Discord.


Primary Sidebar

Related Resources

  • Index Put Protection Is Cheap With 10-Year Treasury Bonds at 5.3%

    Index Put Protection Is Cheap With 10-Year Treasury Bonds at 5.3%

    October 1, 2026
  • Friday Jobs Report Preview: What the Market Wants to See

    Friday Jobs Report Preview: What the Market Wants to See

    October 1, 2026
  • Micron Earnings Preview: Can the AI Memory Boom Keep Delivering?

    Micron Earnings Preview: Can the AI Memory Boom Keep Delivering?

    September 29, 2026
  • Index Put Demand Returns Ahead of Friday’s Jobs Report

    Index Put Demand Returns Ahead of Friday’s Jobs Report

    September 29, 2026
  • AI Trade Drives Nasdaq, Small Caps Lag Behind

    AI Trade Drives Nasdaq, Small Caps Lag Behind

    September 29, 2026
  • youtube
  • x
  • Privacy Policy
  • Disclaimer
  • Terms & Conditions
  • Support Center
  • Media
  • Contact Us

©2026 TenTen Capital LLC DBA SpotGamma

All SpotGamma materials, information, and presentations are for educational purposes only and should not be considered specific investment advice nor recommendations. Futures, foreign currency and options trading contains substantial risk and is not for every investor. An investor could potentially lose all or more than the initial investment. Risk capital is money that can be lost without jeopardizing one's financial security or lifestyle. Only risk capital should be used for trading and only those with sufficient risk capital should consider trading. Past performance is not necessarily indicative of future results. Testimonials appearing on this website may not be representative of other clients or customers and is not a guarantee of future performance or success.

View Full Risk Disclosure