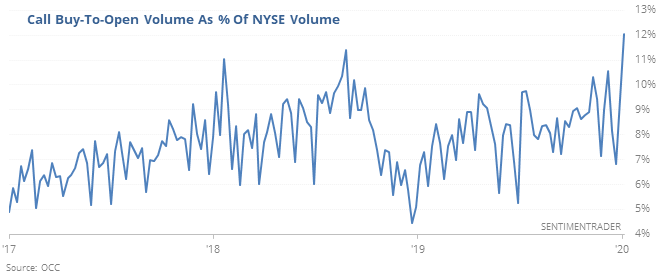
EDIT 1/28/20 : Here is an updated chart tracking this scenario.
Jan 2018/Jan 2020 SPX Analogy by SpotGammaModel on TradingView.com
Original Post: 1/24/20
With major moves higher over the last several months/weeks/days into January one can’t help but draw comparisons to January of 2018. We wrote an in depth review of Jan ’18 here and wanted to look at a few methods that may have helped in calling a top.
First, Jan ’18 OPEX was on Friday the 19th and markets didn’t top until the following Friday (1/26/18). The S&P tacked on 3-4% that week after OPEX. Both markets moved about +10% over 3 months.
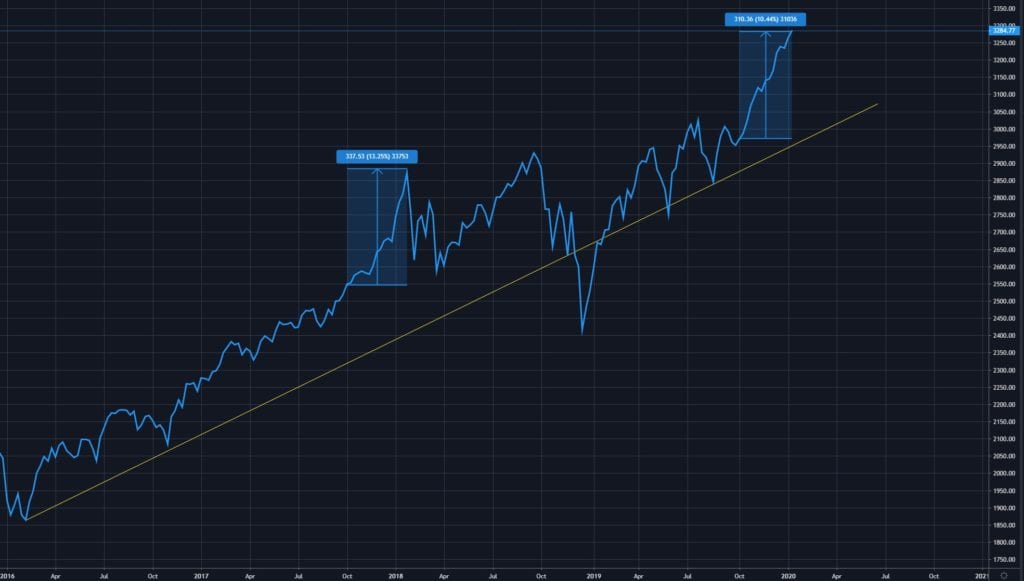
In Jan of ’18 we did have the proliferation of short volatility products (XIV, etc) which led to Feb ’18’s “Volmageddon” – and that may well have had the effect of driving the market higher in Jan ’18. The interesting thing about the Jan ’18 crash is that it brought the market back down to where it was only a few months before (green line in chart below).
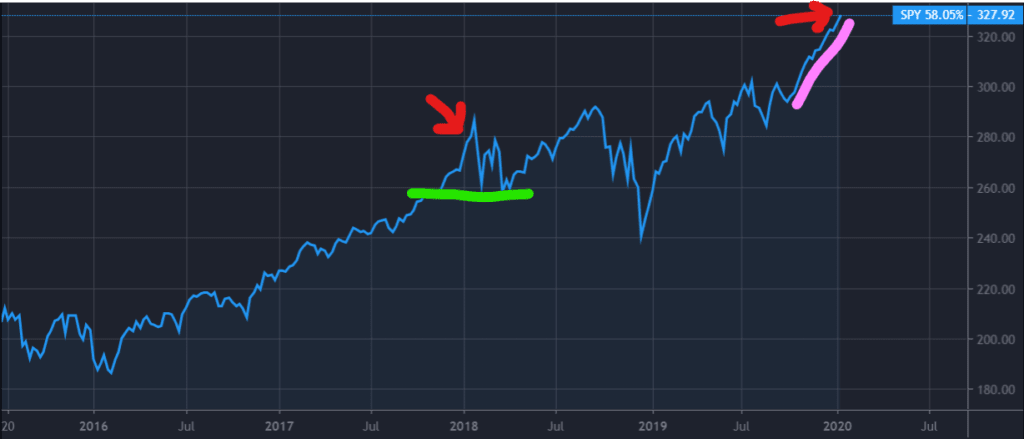
Our backtest data shows something interesting, in that the total gamma declined despite the market moving higher (see chart below, red arrow). Generally gamma increases as the market moves higher into large call open interest. The red arrow is where the market peaked on 1/26/18.
We are not yet seeing this same reduction in total market gamma as the SPX gamma has risen the last week. For the past several months we’ve had this very mechanical rolling of calls which has kept the market-supporting long gamma. With central bank easing and the China deal you have a market that is up a about 10% since October ’19 (pink line chart at top).
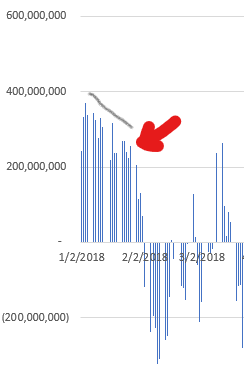
While there is and are many factors contributing to market movement, we believe short term trading can be greatly influenced by options trading. Gamma being reduced into a sharp rise in market prices may have been a signal that the appetite for call positions was dropping. As you can see (red arrow chart below) call deltas peaked on 1/18/19 (the day before OPEX – note options expire at 9:30AM on the 19th so positions are often closed on Thursday). Despite the market being 2-3% higher on 1/26 (blue arrow) deltas didnt outpace pre-OPEX.
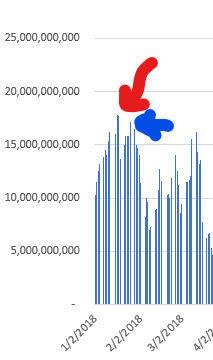
The situation may well have been ITM/ATM calls were rolled to higher strikes which forced dealers to buy back hedges (if dealers were long calls, hedged with short futures). This may help explain some of the sharp movement up post OPEX. Once this hedging is finished, you lose a large buyer at those high price levels and the market isn’t as well supported.
A few days later a bit of selling starts (CNBC blamed the Fed) – but once that selling started there was a an air pocket below, of course leading to/catalyzed by “Volmegddon”.
Its possible we experience a similar topping process in the next few weeks. The “mechanical” buying may stall out, leading to a few days of drift. Then some type of catalyst/excuse causes traders to change the bullish narrative. Without the same level of participation in VIX products its hard to directly compare the situations as clearly those VIX positions had a large impact in Jan/Feb ’18 movement.
Edit: We just came across this chart via @Sentimentrader