We’ve been seeing extreme call/put measures the past several weeks and these extreme measures only give way to more extreme measures. Nomura & JPM noted how heavy call positioning is relative to puts recently. There is also anecdotal evidence like this chart below, where Macrohedged notes: ” We cannot recall EVER seeing max OI for #ES_F on the upside “
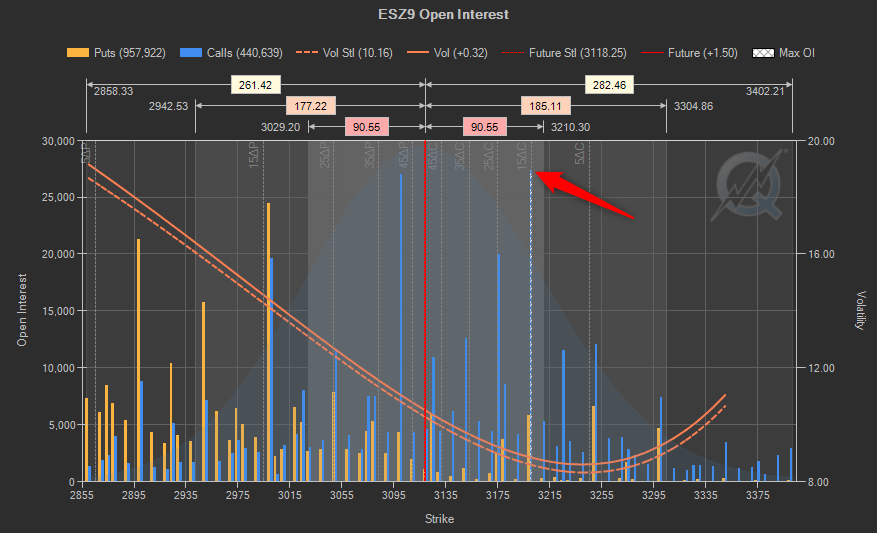
That background theory is key to what we see as taking place to drive this market higher – and that is the call roll gamma trap. “Retail” is also very short volatility. Essentially the market is being controlled by lots gamma and as those call options go in the money and volatility comes in the market pushes up with it. The idea is that at some point this market is going to vertical – the classic “blowoff top”. This may be much like what happened in January of 2018: A reflexive feedback loop of mechanical/technical buying.
You can see in the chart below that the market had already moved sharply into Jan ’18, then went all-out in January.
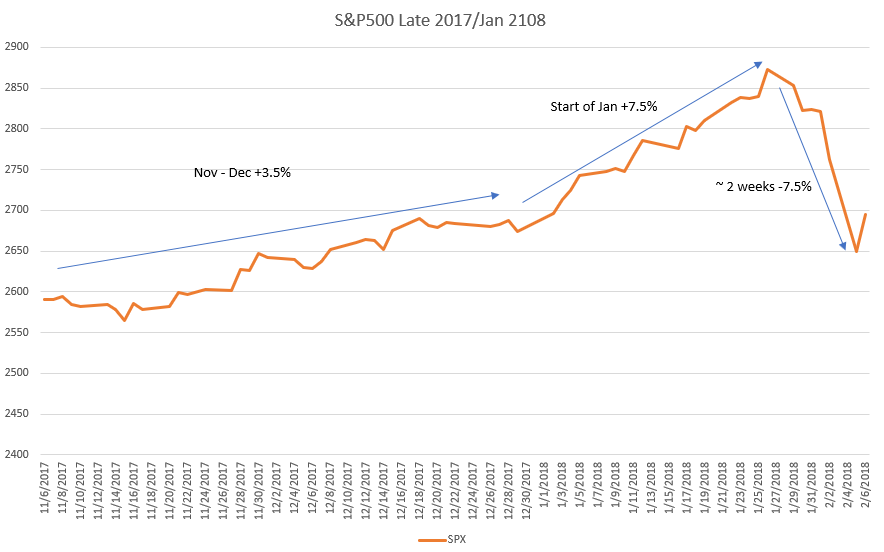
From late 2017:
This has become a self-fulfilling prophecy. Because no one believes that these vol. spikes will be sustained, vol. sellers immediately re-engage. Now think about what that means for the people who take the other side of those trades. As Deutsche Bank’s Aleksandar Kocic reminds you, “dealers who take the other side of that trade, through their hedging, reinforce local stability making resistance even more futile.” Have a look at this chart:
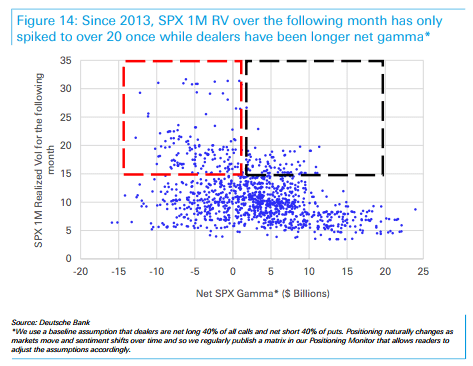
DB Continues:
See what I mean? This is a loop. But inherent in that loop is the idea that the market is becoming more fragile. The buildup of rebalance risk from levered and short VIX ETPs creates the conditions for a turbocharged vol. spike that could then spillover as it forces the hands of vol.-sensitive systematic strats.
The best piece I’ve found on the options/volatility landscape from late 2017 is here. JPM’s Kolanovic may the father of market gammma analysis and said this in late ’17:
Tail Risk for equities and other risky asset classes will increase in 2018. Our [JPM] analyses point to a significant impact of monetary stimulus removal on levels of risk premia across asset classes, levels of leverage and valuations. However, asset classes may not react immediately, and like a ‘frog being boiled’ tail risks may be realized with a significant delay and triggered by an unrelated catalyst. The tail risk could manifest itself with forced deleverage of systematic strategies (options hedging/dynamical delta hedging, volatility targeting, risk parity, trend following), disruptions to market liquidity, and failure of bonds to offset equity risk.
I’m pretty sure that underlined piece is exactly what finally broke the market in late January. Everyone was on one side of the boat – and when it unwound it unwound quickly. The problem is that if you felt that way in December of 2017 you may have missed 10% (!!!) in a few short weeks. Its very tough to figure out where we may be in the analogy – the performance of the SPX the last several weeks has been very strong (~+7% in 6-7 weeks).
What we will be looking for is a decrease in market gamma (at the time of writing its ~$2.4bn) as well as a lack of appetite to roll those calls higher. The Fed meeting in mid-December also pops up as a catalyst. Lastly December OPEX is a large one and that may set the state for a larger move.