This week saw the zombie market resume with suppressed volatility and a broader market remaining constrained by positive gamma. SPX closed the week at 6,460, grinding slightly higher throughout the week before the rug was pulled on Friday.
NVIDIA earnings on Wednesday served as the pivotal moment that shaped both volatility patterns and the broader market narrative, and despite Friday’s end-of-week hiccup the major indices closed flat for the week.
While the S&P 500 remains in highly positive dealer gamma, this exposure is somewhat unstable given the narrow range around current price levels (6,450-6,550), meaning any significant move in either direction could quickly erode dealer hedges and accelerate price action.
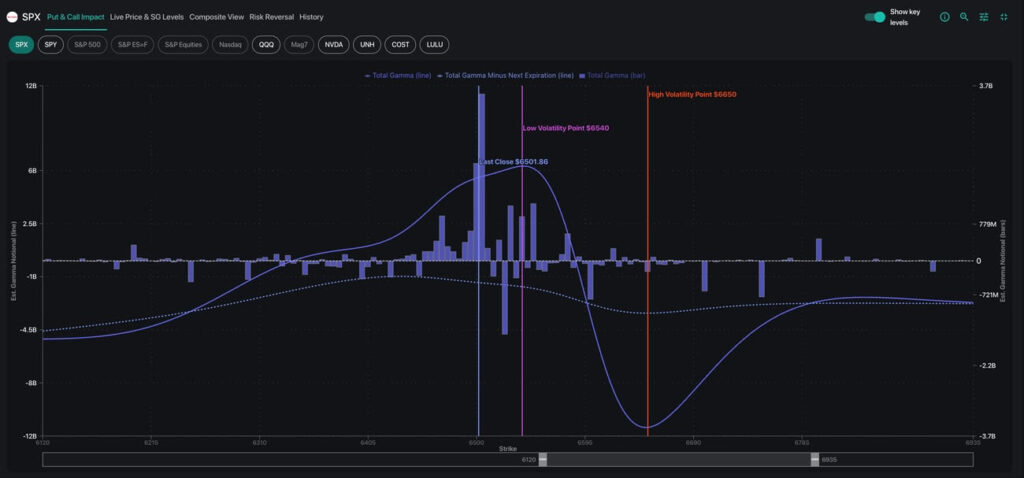
Approximately $7 billion of long gamma positioning expired on Friday, which suggests that by next week the market will enter September with a flatter cumulative gamma profile (dotted line on the image above).
NVDA Volatility Collapses Post-Earnings
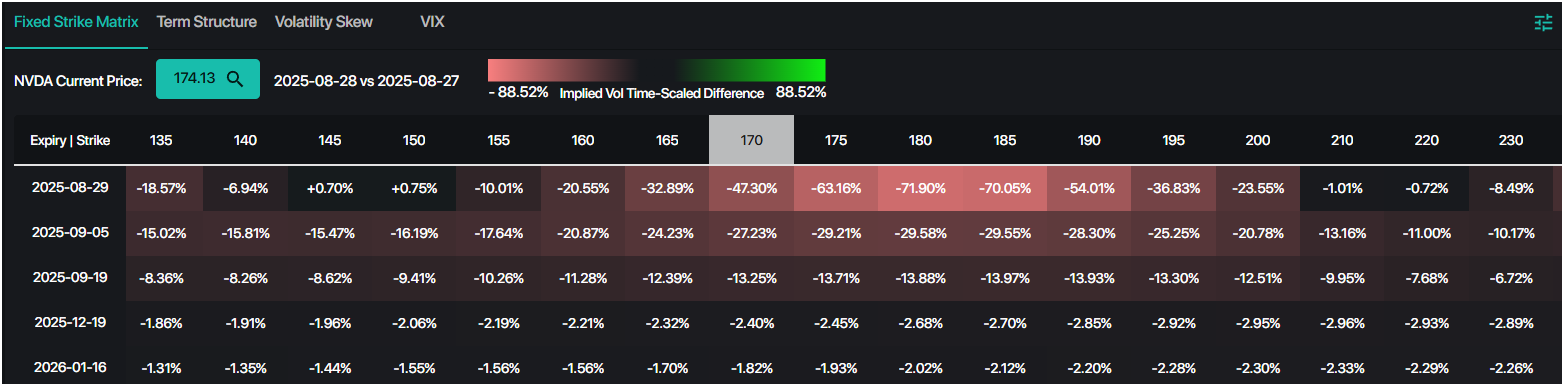
NVDA’s earnings report on Wednesday exemplified what we call a “failed to meet expectations” outcome: not quite a miss, but not the blowout many hoped for. However, NVDA was trading amidst a highly positive gamma range between $180-$200, limiting the stock’s movement as dealers hedged against price action.
More importantly, NVDA’s post-earnings volatility crashed from the top of its 90-day range to the bottom of the range, with IVs collapsing across virtually all strikes and expirations.
Given that NVDA constitutes 7.5% of the S&P 500, this vol crush became the primary driver of the market’s steady grind higher on Thursday, as vanna flows pushed SPX toward the 6,500-6,525 resistance zone – hitting “play” on the zombie market once more.
Trade Highlight: Downside Protection Unusually Cheap
Friday’s AM Founder’s Note highlighted an asymmetric opportunity to capitalize on the market’s lack of any bearish expectations. With SPX traders assigning nearly zero chance of extended downside, deep out-of-the-money put butterflies offered 10-to-1 payoff potential for minimal premium. The suggested 6,000/5,900/5,800 put fly structure for September 19th costs roughly 75 cents but would deliver meaningful payout if any significant selloff materializes.
This isn’t about predicting doom — it’s about recognizing that option prices might fail to reflect tail risks appropriately. Furthermore, gamma exposure from Synthetic OI data shows dealers holding significant short put positions through the 6,100s, creating potential acceleration points if any major sell-off begins.
The September Catalyst Cluster
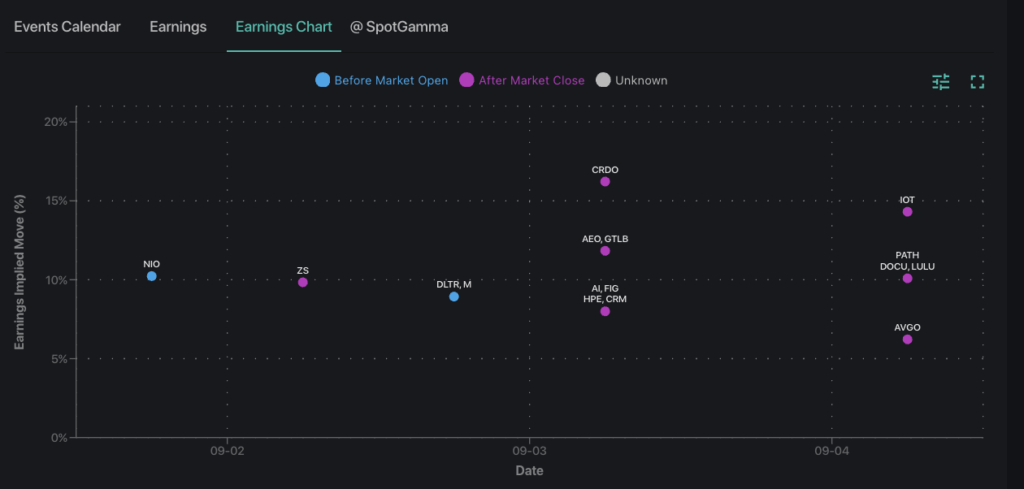
The upcoming week features a holiday-shortened schedule with markets closed Monday for Labor Day, followed by important earnings from Salesforce (CRM) and American Eagle (AEO) on Wednesday, then Broadcom (AVGO) and Lululemon (LULU) on Thursday. Friday’s Non-Farm Payrolls report serves as the week’s primary macro catalyst.
Looking ahead, the September 17-19 window deserves particular attention. With the FOMC and VIX expiration on September 17 followed by OPEX on the September 19, we’re watching for potential “vol spasm” risks. History suggests these ultra-low volatility periods often end abruptly around major options expirations.
Until then, the current market setup favors momentum strategies over mean reversion. SpotGamma’s key levels provide the roadmap for daily positioning, and our Volatility Dashboard monitors for real-time changes in volatility across the US equities market.
For futures and index traders using TRACE, 0DTE flows will likely continue to drive price action, making gamma-by-strike essential to reference for both entries and exits.
