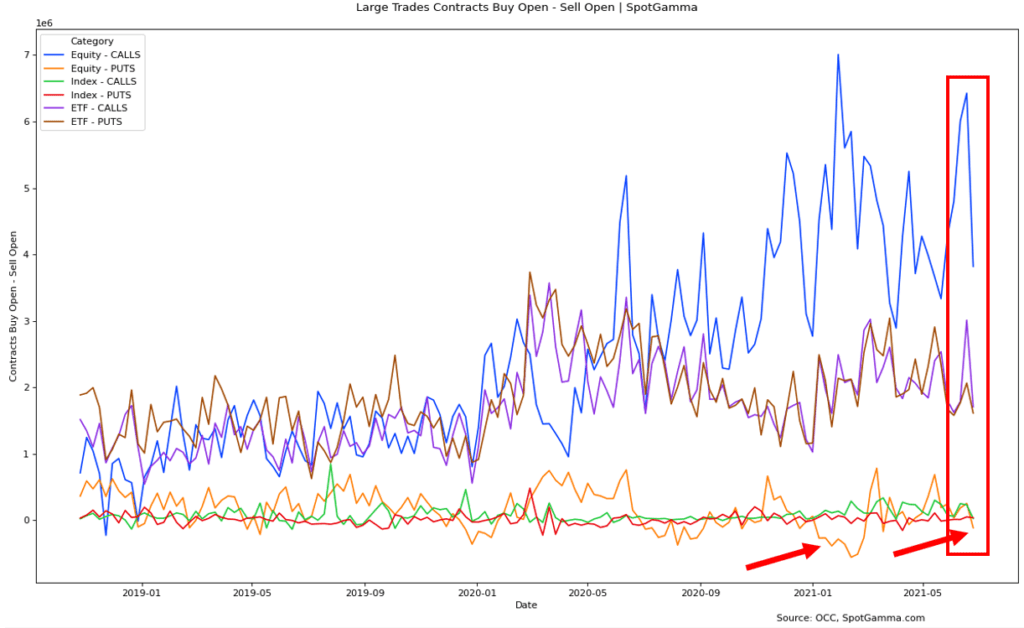
SpotGamma collects raw data which sheds light on the previous weeks options transactions. This past weeks data was quite interesting in light of several of the developments which took place last week. Below we’ve taken the total number of contracts bought to open, netted against contracts sold to open. Here we are only showing large trades in an attempt to filter out retail order flow.
- There was large selling to open across the board, but particularly in calls. This can be seen in the red box. Equity calls, ETF calls and Index calls all saw sharp declines week over week indicating less bullish flow than prior weeks. While some of this may be related to a new quarter starting (the mid-year options expiration was 6/18), its also the week where markets reached all time highs.
- Equity put options were net sold to open as shown by the right red arrow. The last time this happened was in Q1 during “meme-mania”. We wrote extensively on GME put selling from that period, and note put selling as a way sophisticated hedge funds may implement volatility based trading strategies.

The other flag that comes with this “net put selling” is that it can be a sign of rampant speculation. The previous three time frames with serious instances of similar behavior all let to volatile periods in the market. Those periods are: Feb ’20, August ’20 and Feb ’21 and are all marked in the chart below.

When you have many traders short puts, If/when markets weaken these traders must act quickly to cover their positions. They’d do this by having to buy put options, which could lead to options dealers having ti initiate short hedges.
However, before waving a red flag we need to see future data points that show similar behavior.
