• Skip to content
  • Skip to primary sidebar

SpotGamma™

S&P 500 Stock Market Gamma Trading Levels Based on Options Open Interest

  • Subscribe Now
  • Products
  • Blog
  • FAQ
  • Contact
    • About
  • Members
    • Account
    • Portal
    • Equity Hub 2.0

Aug 12 2020

Gamma Level Resistance – A Visualization

Today provided an excellent example of key resistance at an important options level in the SPX/ES. As you can see the market had a consistent bid from the open right into our 3387 SPX level (yellow arrow, left). The market spend much of the afternoon up against that resistance area, and finally rejected it towards the close of trading.

Options Gamma Resistance SPX ES Futures

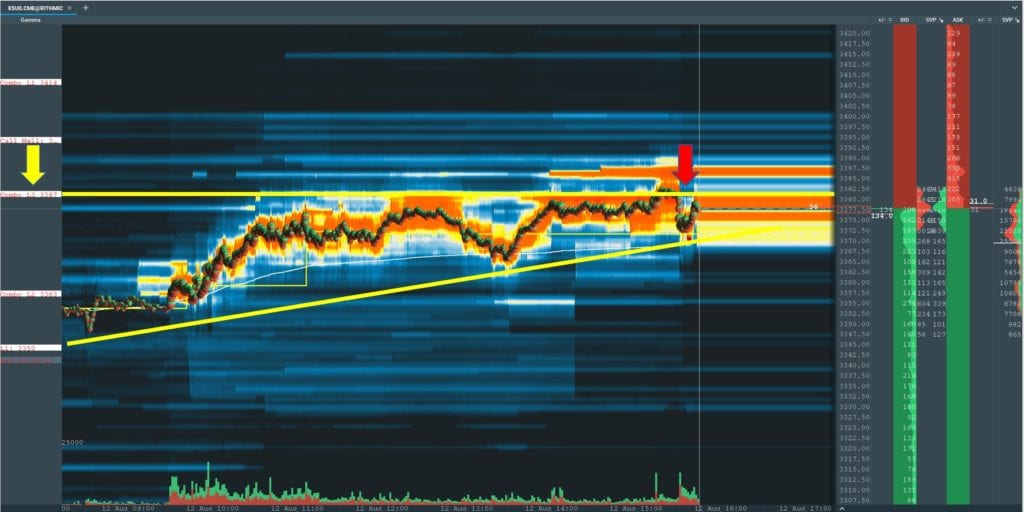
Our view here is that hedging flow is capping the market here, but light buying volume creates a “pin” area of sorts as the flows match at the 3387 price area. As soon as buying volume releases (red arrow, at right) you see the options related flow push the market lower. When that hedge volume pulls back we see a mean reversion back to the 3387 price area.

  • Click to share on Twitter (Opens in new window)
  • Click to share on Facebook (Opens in new window)
  • Click to share on LinkedIn (Opens in new window)
  • Click to share on Reddit (Opens in new window)

Written by Spot Gamma · Categorized: Market Analysis · Tagged: ES, gamma, support

Primary Sidebar

Popular Posts

spotgamma-sidebar-weaponized-gamma-sidebar
spotgamma-sidebar-yolo-trade
did-softbank-weaponize-options-gamma-whale
goldman-gamma-op-ex-option-driven-equity-flow
spotgamma-on-the-market-huddle

Categories

  • Market Analysis (258)
  • SpotGamma Updates (4)
  • Stock (47)
  • Trade (3)
Follow @spotgamma on Twitter!
  • Subscribe
  • Disclaimer
  • Account
  • Portal

©2021 TenTen Capital LLC DBA SpotGamma