• Skip to content
  • Skip to primary sidebar

SpotGamma™

S&P 500 Stock Market Gamma Trading Levels Based on Options Open Interest

  • Subscribe Now
  • Products
  • Blog
  • FAQ
  • Contact
    • About
  • Members
    • Account
    • Portal
    • Equity Hub 2.0

Oct 23 2019

Recent JPM Gamma Analysis

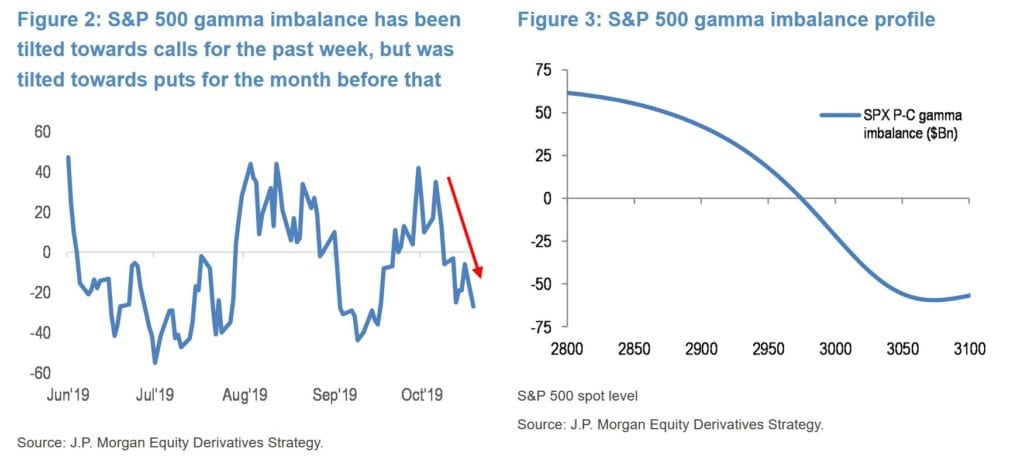
JPM recently put out the following charts on S&P500 Gamma including a ratio of call gamma to put gamma which is quite interesting. It shows the amount of call gamma minus put gamma which could be interpreted in a few different ways. One way would be to look at it as how the market is hedged, meaning if there is a large call gamma to put gamma maybe the market is not well hedged for a drop.

JPM Gamma charts from 10/23/2019

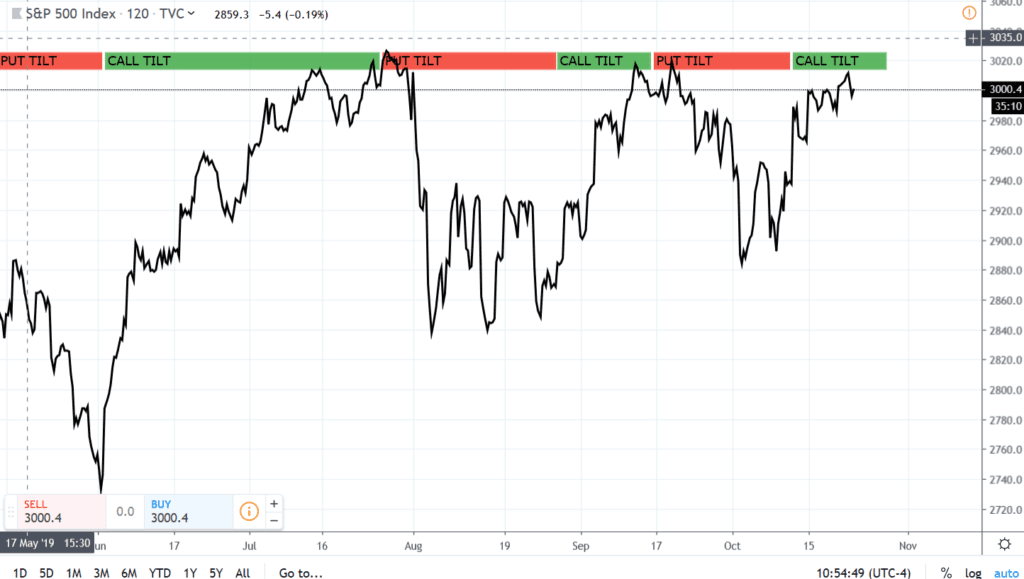
Here is an SPX chart labeled with the “tilt” from the top left gamma chart. Certainly not assuming we get a selloff here, but the market currently has a “call tilt” which appears to be related to short term tops.

  • Click to share on Twitter (Opens in new window)
  • Click to share on Facebook (Opens in new window)
  • Click to share on LinkedIn (Opens in new window)
  • Click to share on Reddit (Opens in new window)

Written by Spot Gamma · Categorized: Gamma Model Output · Tagged: call gamma, gamma tilt, put gamma

Primary Sidebar

Popular Posts

spotgamma-sidebar-weaponized-gamma-sidebar
spotgamma-sidebar-yolo-trade
did-softbank-weaponize-options-gamma-whale
goldman-gamma-op-ex-option-driven-equity-flow
spotgamma-on-the-market-huddle

Categories

  • Dark Pool (1)
  • Market Analysis (262)
  • SpotGamma Updates (4)
  • Stock (47)
  • Trade (3)
Follow @spotgamma on Twitter!
  • Subscribe
  • Disclaimer
  • Account
  • Portal

©2021 TenTen Capital LLC DBA SpotGamma