• Skip to main content
  • Skip to primary sidebar

SpotGamma™

S&P 500 Stock Market Gamma Trading Levels Based on Options Open Interest

  • About
  • Pricing
  • Academy
  • Resources
    • Tool Demos
    • Case Studies
    • Blog
    • Support Center
    • Free Daily Report
    • Free Trading Tools
      • Options Profit Calculator
      • SPX Gamma Exposure
      • Implied Earnings Moves
      • Volatility Ranking
    • Free Training
    • Report Card
  • Login

gamma tilt

Feb 27 2020

Searching for a Market Bounce: Feb 2020

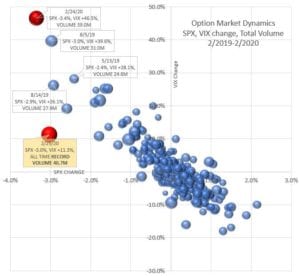
Scatter plot of SPX vs VIX percent changes Feb 2019-2020 with volume bubbles highlighting large selloffs.

Below are a few charts that we’ve been watching as we’re in the midst of the Crash of Feb 2020. Several indicators are showing extreme readings and we wanted to chronicle those. If you have one you think we should add email us: sg@spotgamma.com. One of the things we look at “Gamma Tilt” which is […]

Written by tenten · Categorized: Market Analysis · Tagged: gamma tilt, market bottom, put call ratio, record options, volume

Feb 25 2020

Gamma Tilt & Market Bottoms

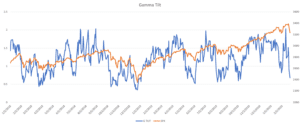
Dual-axis line chart titled Gamma Tilt of blue G TILT and orange SPX from Jan 2018 to Feb 2020.

One of the indicators we watch for a potential bottom is Gamma Tilt – or the ratio of call gamma to put gamma. When this level hits lows it may be an indication that the market is oversold. Currently the S&P500 Index is about 8% in ~5 trading days. Here is the current indicator for […]

Written by SpotGamma · Categorized: Market Analysis · Tagged: February 2020 crash, gamma tilt, oversold indicator

Oct 23 2019

Recent JPM Gamma Analysis

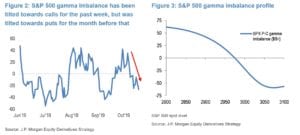
Two line charts show S&P 500 gamma imbalance over June-October 2019 and versus spot from 2800 to 3100.

JPM recently put out the following charts on S&P500 Gamma including a ratio of call gamma to put gamma which is quite interesting. It shows the amount of call gamma minus put gamma which could be interpreted in a few different ways. One way would be to look at it as how the market is […]

Written by SpotGamma · Categorized: Gamma Model Output · Tagged: call gamma, gamma tilt, put gamma

Primary Sidebar

SpotGamma-Subscriber-Signup-Banner

  • AI Stocks Options Positioning: Call Selling, Not Put Buying
  • FOMC Preview: The Hike Is Priced. The Dots Aren’t.
  • Gamma Guy: S&P 500 Realized Volatility Is the Lowest Since 2020
  • UBER Insider Buying: A $10 Million Vote of Confidence
  • Hedging Against a Volatility Spike: VIX Calls vs. SPX Puts
  • youtube
  • x
  • Privacy Policy
  • Disclaimer
  • Terms & Conditions
  • Support Center
  • Media
  • Contact Us

©2026 TenTen Capital LLC DBA SpotGamma

All SpotGamma materials, information, and presentations are for educational purposes only and should not be considered specific investment advice nor recommendations. Futures, foreign currency and options trading contains substantial risk and is not for every investor. An investor could potentially lose all or more than the initial investment. Risk capital is money that can be lost without jeopardizing one's financial security or lifestyle. Only risk capital should be used for trading and only those with sufficient risk capital should consider trading. Past performance is not necessarily indicative of future results. Testimonials appearing on this website may not be representative of other clients or customers and is not a guarantee of future performance or success.

View Full Risk Disclosure