Key Takeaway: On April 23, a trader or group unloaded 37,000 SPX call contracts in under 30 minutes — a massive move that helped wipe out billions in market value and trigger an 81-handle selloff.
It looked bullish. It wasn’t.
This was a synthetic short, a hidden bearish bet most traders misread completely. Why? Because the flow looked like buying — unless you had the tools to spot what was really happening. This post breaks it all down, and shows how to catch the next setup before it shakes the market.
Most traders blamed headlines. But the price action preceded the headlines.
The setup: When a “call buy” isn’t bullish at all
On April 23, between 10:50am and 11am ET, a trader (or group) bought ~37,000 SPX 5520 calls in under 30 minutes. At face value, this looks like the culmination of a monster bullish bet. But it wasn’t.
This was a synthetic short — a complex position designed to take advantage of downside price action.
And most traders reading a standard options feed may have completely missed the signal.
Unless you had HIRO, TRACE, and Tape in your toolkit, you were missing the setup beneath the surface.
The assumption that trips up even veteran traders
Options traders thrive on pattern recognition. We build mental shortcuts over time:
- Long call = bullish
- Long put = bearish
- Short put = bullish income
- Short call = bearish
These assumptions are rooted in truth, but they can limit perspective — especially when trades get more complex.
For example, some experienced traders use spreads to reduce capital requirements or manage risk. Others sell premium through strategies like covered calls or naked puts to collect theta. While these techniques are valid, they can also reinforce surface-level interpretations that miss the true structure of a trade.
And that’s exactly what happened here. The trader used long calls, but in a synthetic way that created a bearish position. Without seeing the full structure, most traders may have misread it entirely.
These heuristics work well — until they don’t. Especially when it comes to trades that are structured for something more nuanced.
That’s what made this trade counterintuitive. The trader used long calls to take a short view — a tactic that catches even seasoned traders off guard. Without recognizing the underlying structure, it’s easy to misread intent.
What most traders don’t see: The math behind the misread
This trade wasn’t a simple call buy. It was a synthetic short, built on put-call parity.
Put-Call Parity: Long Call + Short Stock = Synthetic Long Put
While this expression simplifies the full math of put-call parity, it gets us close enough to understand the core concept: combining a long call with short stock can replicate the risk/reward profile of a long put. In reality, cash and interest rate terms also factor in, but the structure here was functionally bearish.
By buying calls and selling the underlying, a trader can replicate the risk/reward profile of a long put.
And when structured correctly, it offers nearly 1:1 delta exposure while using less capital. The takeaway: Structure often matters more than which side of the options chain a trade appears on. It’s this nuance that many surface-level flow readings can miss — especially when size, timing, and position context aren’t aligned.
Why you can’t rely on “buy/sell” labels alone
Most feeds claim to show trade direction — but that direction is based on inference, not confirmed execution. And while those inferences are often highly accurate, especially with modern modeling, they’re still best-guess estimates.
To move past even the best inferences, you need tools that show how those trades impact dealer behavior in real time — not just what they look like on the surface.
How the right trading tools uncover the truth
Tape: Spotting the setup in real time
Tape is SpotGamma’s real-time options trade filter. It allows you to:
- Sort trades by strike, type, size, or time
- Isolate activity by ticker or contract
- View large trades without filtering for aggressor side
In this case, we filtered for SPX 5520 calls and sorted by size. What we saw was clear: massive trade volume clustered at one strike in rapid succession. No need to tag aggressor side — the sizing alone signaled this was worth watching.
Benefit to traders: Tape offers an unfiltered view of real flow. It helps you catch whales in real time, spot strike-level positioning, and zero in on institutional setups.
HIRO: Reading the delta shift
Tape showed us the size. HIRO showed us the direction. Around 11:15am ET, HIRO picked up a sharp delta shift:
- Cumulative delta dropped from ~(-60k) to ~(-150k)
- Clear build-up of short delta positioning
- Flow hit before price followed
HIRO, like Tape, uses modeled assumptions to estimate trade direction based on available market data. What sets HIRO apart is how it visualizes those assumptions through real-time shifts in dealer delta, offering traders a clearer view into how flow may be influencing dealer behavior.
Benefit to traders: HIRO helps you confirm trade directionality, understand the likely hedging response from dealers, and gauge how flow might move the market — not just mirror it. Pairing HIRO with TRACE helps validate whether the flow you’re seeing is directional, hedged, or part of a larger synthetic position.
From flow to fact: How TRACE confirms dealer exposure
After the dust settled and the full position was on, one thing stood out: SPX 5520 lit up as a massive dealer short gamma zone — and TRACE caught the build in real time.
 |  |  |  |  |
SpotGamma TRACE Mobile Screenshots – 10:50am to 11:30am ET
Watch how Net OI explodes from under 1,000 to over 30,000 contracts at that strike. There’s no ambiguity here. TRACE shows actual market maker positioning.
By the 11:10am update, just before the size lit up in Tape and headlines hit the wires, TRACE confirmed three key things:
- A large dealer short gamma position was building
- It was concentrated in OTM calls
- The market was already starting to sell off, with volume
Here’s why that matters: As the trader continued building the short position and the market began to drop, those OTM calls rapidly lost delta. Market makers, hedging the expanding short gamma exposure, no longer needed the same level of long delta. So they began unwinding — selling stock into the decline and adding fuel to the move.
The result? An 81-handle slide that didn’t come from a tweet or a Fed surprise. And if you didn’t see the TRACE print, you probably blamed it on headlines.
But now you know better. Next time something like this sets up, cycle through Tape → HIRO → TRACE to build your conviction. The setup might be subtle, but the positioning pressure is real — and tradable.
Benefit to traders: TRACE gives you a near-real-time map of dealer positioning. That means you can anticipate volatility, understand gamma exposure, and trade with the forces driving the market, not against them.
How it played out — And why this trade moved the market
Here’s how it all played out in sequence:
- 10:50am – TRACE update shows no major OI yet
- 11:00–11:30am: Another ~34,000 contracts came in, overwhelming the earlier trades and pushing them out of the filtered view.
- 11:15am – Tape shows large call trades hit; HIRO detects a surge in short delta
- 11:40am – TRACE confirms massive dealer short gamma
- SPX breaks down ~81 handles, fueled by dealer hedging
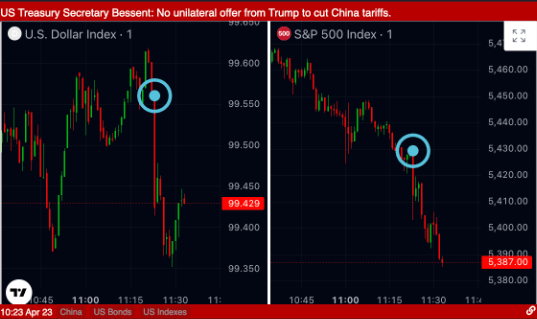
Things really kicked off at about 11:15 market time, just before Sec Bessent spoke to media.

This view of SpotGamma Tape is filtered for calls at the 5520 strike and sorted by trade size — without selecting an aggressor. We’re capturing all large trades to analyze how they align. The list shows the top 11 trades by size so far, though sorting by size can shift the visual order of execution. For large-scale activity like this, timestamp is the primary sorting tool, with volume used secondarily to help isolate a potential whale.
Financial Juice captured comments, as well as market action, around that period in a great visual:

Source: Financial Juice headlines and corresponding market action
Notice, Financial Juice is highlighting when Sec. Bessent actually started speaking. But we know the market was starting to sell off before that.
Most traders blamed headlines. But the price action preceded the headlines.
The real catalyst? A major short trader.
This trader didn’t need to be right on the news — they just had to be early on how positioning would react to it.
How to read between the lines of big trades
If you’re trading options based on flow, here are a few valuable takeaways to keep in mind:
If you’re trading options based on flow, here are a few valuable takeaways to keep in mind:
- Not all long calls are bullish
Structure matters. The presence of stock or other legs can flip the intent of a trade.
- Feeds like OPRA don’t show side or context
OPRA, stands for Options Price Reporting Authority. It’s their job to report the last sale and pricing data of options trades as designated by the SEC. The issue is that none of the information OPRA (or other entities) provides empirically tells you if the option traded was bought or sold. Instead, you’re looking at size, price, and timing, not intention. You need tools that reveal what’s happening under the surface.
- Dealers drive direction
Understand where they’re short gamma and how they’re forced to hedge. That’s what moves the market.
Turn flow into tradable insight with SpotGamma’s proprietary tools
SpotGamma’s powerful ecosystem of industry-leading tools, in-depth analysis, and rich trader support was built to replace noise with clarity — helping you decode positioning pressure and stay a step ahead of the market. Here’s how each of the core tools we’ve discussed powers that edge:
✅ Tape
- Spot large orders as they hit
- Track which strikes are in play
- Identify unusual sizing and repeat activity
✅ HIRO
- Follow directional delta shifts
- See how dealer hedging is evolving
- Confirm momentum before the chart confirms it
✅ TRACE
- See real dealer positioning
- Monitor net open interest by strike
- Anticipate volatility by reading gamma exposure
Together, these tools give you a 360-degree view of positioning — letting you time entries with more confidence, size with precision, and stay ahead of moves most traders don’t see coming.
TL;DR: Want to stop guessing? Here’s how to start tracking
That 37,000-lot call buy wasn’t bullish. It was a synthetic short that helped trigger a major market drop.
And if you didn’t have SpotGamma tools, you probably missed the setup.
But now you know:
- Tape shows the size and timing — helping you catch large trades as they hit and quickly zero in on where institutional interest is building.
- HIRO reveals directional pressure — showing you how dealer hedging is shifting in real time, so you can anticipate moves before they hit the chart.
- TRACE confirms dealer exposure — giving you verified positioning data that shows where the pressure is real and how it might fuel price movement.
Ready to start seeing what most traders miss?
Uncover hidden flows, decode market signals, and start maximizing your wins. Hack Wall Street’s playbook. Choose your plan.