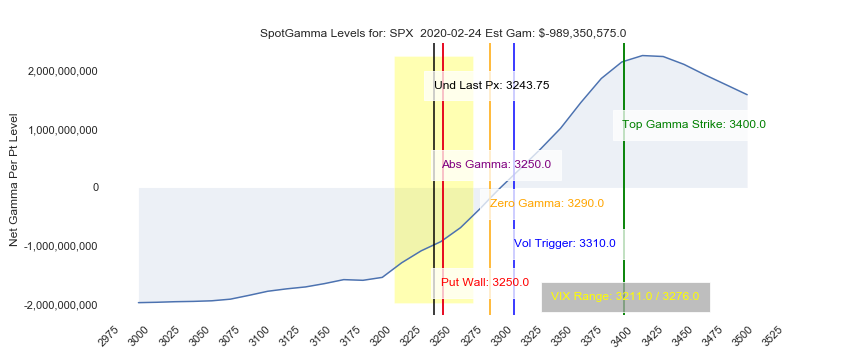
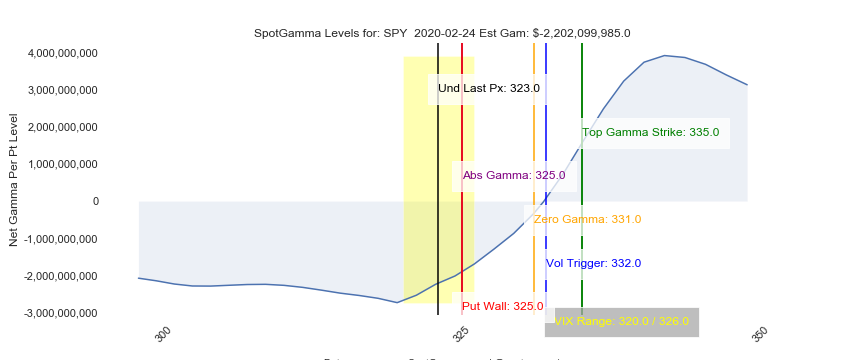
| We’ve moved well through the zero gamma area and are testing the first “put wall” and “absolute gamma strike”. Puts are now in control of gamma which indicates more volatility ahead. I would not look at the put wall as a solid support line, but more of a pivot or “band” around which larger moves occur. Being that 3250 is the absolute gamma strike it may function as a support/resistance level. At the moment with negative gamma any new negative headlines or added selling may push dealers to add to that selling and could further expand volatility. There is another concentration of puts around 3200 combined with being a “round number” which may function as support – the key here is to give lots of room for volatility in both directions. Support levels may not matter much in the face of margin calls and other forced selling. Recall that if/when puts are closed or rolled in size that could spark moves higher in the market as dealers close short hedges. We can therefore see significant moves higher in the context of a larger move lower. We would look at 3300 (zero gamma) as resistance if this market does recover. We will be watching trend/movement in the VIX index for signals – lower VIX may mean higher SPX and higher VIX may indicate more SPX selling to come. |
| Event | Time EST | Actual | Forecast | Previous |
|---|---|---|---|---|
| No events | – | – | – | – |
| Signal Name | Latest Data | Previous |
|---|---|---|
| SPX Ref: | 3252.25 | 3339.0 |
| VIX Ref: | 23.11 | 17.11 |
| Gamma Per Point: | $-895,896,852.00 | $826,750,595.92 |
| Zero Gamma Level: | 3284.0 | 3288.0 |
| Vol Trig: | 3310.0 | 3310.0 |
| High Gamma Strike Resistance: | 3400.0 Size: 1/10 | 3400.0 |
| Top Abs. Gamma Strike: | 3250.0 | 3375.0 |
| Put Wall Support: | 3250.0 Size: 6/10 | 3250.0 |
| Call Wall Strike: | 3400.0 Size: 1/10 | 3400.0 |
| CP Gam Tilt: | 0.72 | 1.36 |
| Net Delta: | $2,136,656,054.00 | $7,124,561,227.00 |
| Model Forecast: |
|---|
| Intraday support/resistance levels (during high gamma periods): 3400.0, 3450.0, 3500.0, 3330.0, 3375.0 SPX is below the volatility trigger. The 3284.0level is first level of support and is critical as its the negative gamma threshold. The trigger level of: 3310.0 will act as overhead resistance. Watching VIX is key, if volatility comes in dealers will start to buy back shares as their short puts lose value. This could start a rally. The total gamma has moved DOWN: $-895,896,852.00 from: $826,750,595.92 Gamma is tilted towards Puts, may indicate puts are expensive Negative gamma is moderate favoring further swings in the market |
| Subscriber Only Site Links: |
|---|
| Sub Login Follow @SpotGamma Strike Charts Historical Chart Gamma Expiration Tool |