Daily Note:
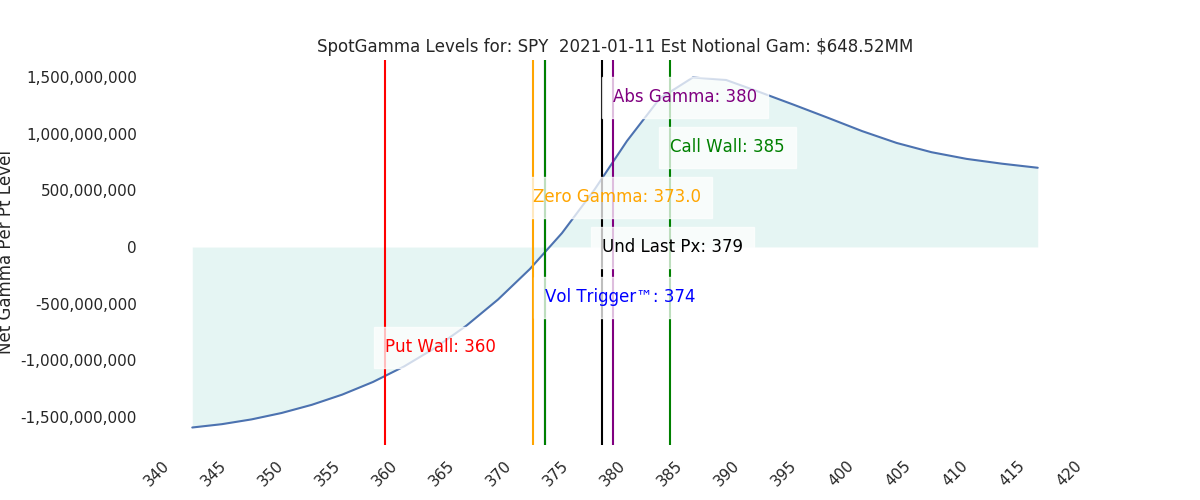
Futures have retraced the late Friday moved from 3825 to 3790. Interestingly our Call Wall metric rolled higher to 3850, but notional gamma levels are down across all indicies. The likely reason for the Call Wall shifting higher was 30k put volume at 3800 and a small net reduction in calls at 3800. This is not the ideal condition for a Call Wall roll – we’d prefer to see large call volume at 3850 as the driver, as opposed to attrition at 3800. All told the options structure weakened a bit over the weekend.
The 3800 put position solidifies that strike as the key pivot area going into Friday OPEX with 3850 the new top of range, and 3750 critical support.
Markets starting off today with a bit of pressure is likely due to chunks of SPX + single stock call positions closed on Friday. We don’t (yet) think this is going to manifest into larger selling, but there are some fascinating this happening under the hood. That being said, a break of 3750 is likely where gamma flips negative and leads to a larger drawdown.
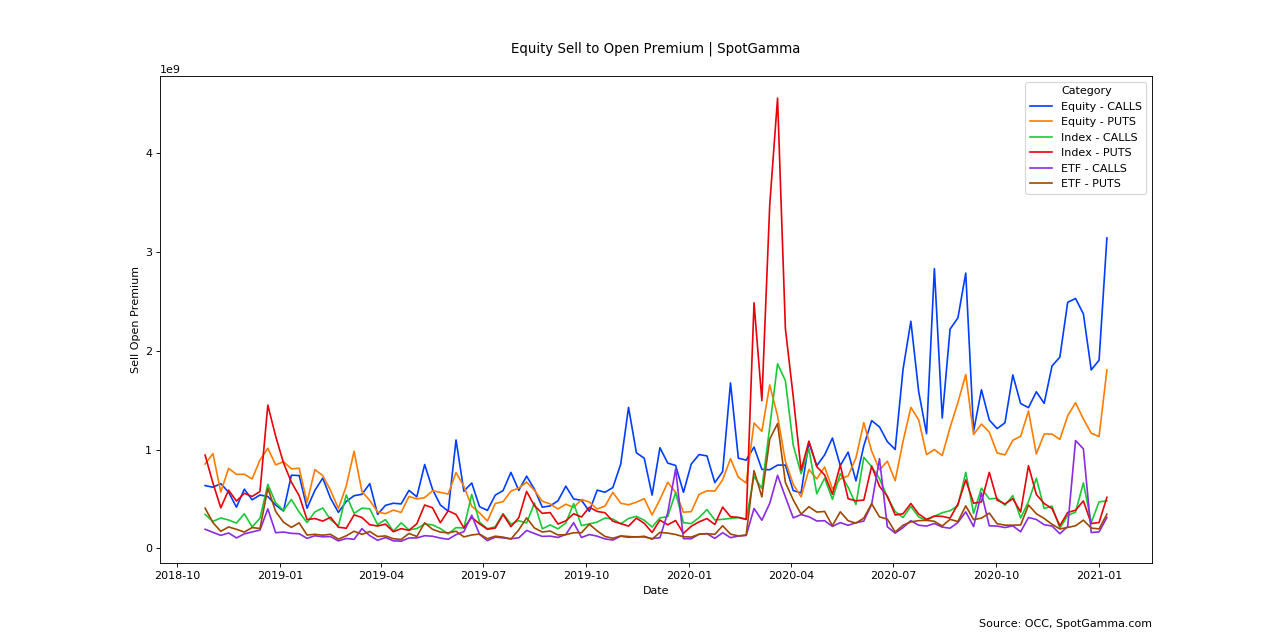
First, note the OCC weekly position updates below. We publicly shared the “Buy to Open” chart (first graph) but kept the “payload” for subscribers today.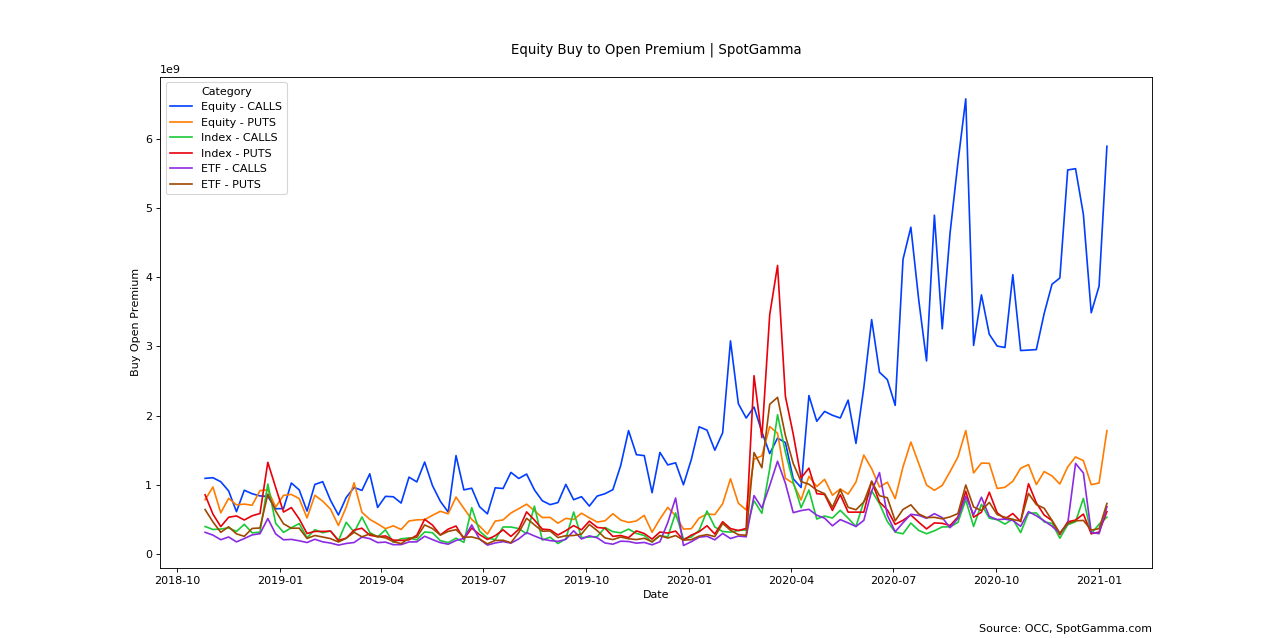
Note the very large SELL to open premium. We suspect TSLA is a fair share of this, and that may infer TSLA is something of a “short cover” trade (more on this to come). There was also a high on a contract basis indicating this options premium selling had a broad reach.
Next, note our Equity Gamma charts which show a drawdown in total equity gamma following 1/8 OPEX. This is what infers to us there are some decent sized hedge adjustments taking place this morning.
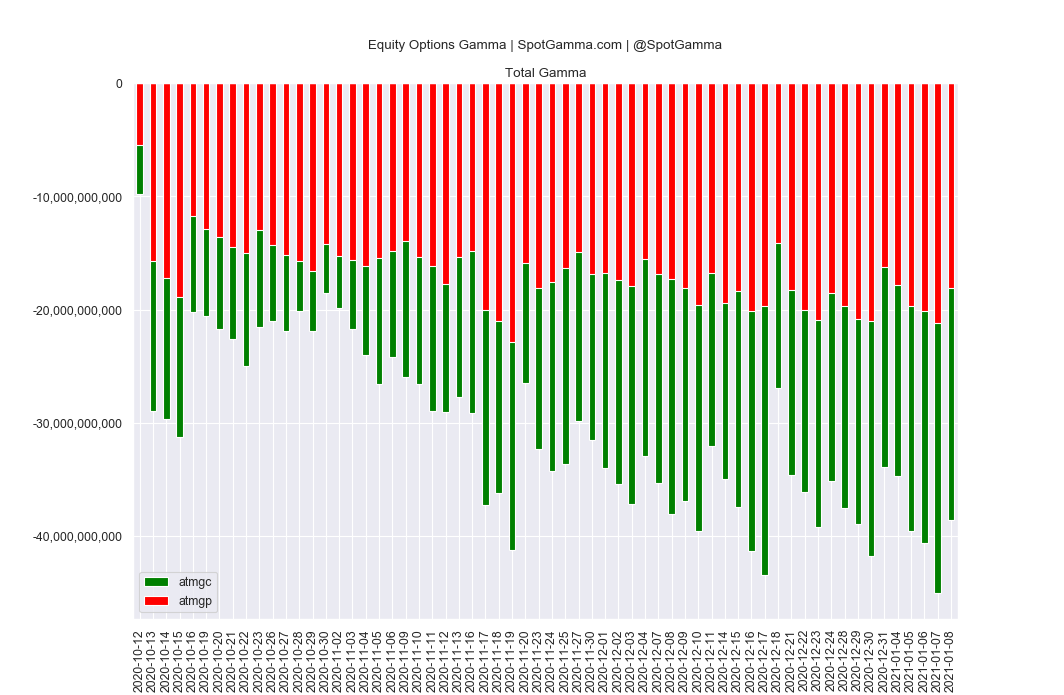
The selling of options is a fascinating shift in light of the record options volume seen this past week. There is a huge options buying force, that was met with a large options selling force. Buying is still 2x larger, but this is a very interesting development – particularly if put purchases increase in addition to call selling. All this leads into this large 1/15 expiration in which >50% of single stock names have their largest gamma concentration.
Macro Note:
3750-3800 Jan Exp Range.
| Signal Name | Latest Data | Previous | SPY | NDX | QQQ | ||
|---|---|---|---|---|---|---|---|
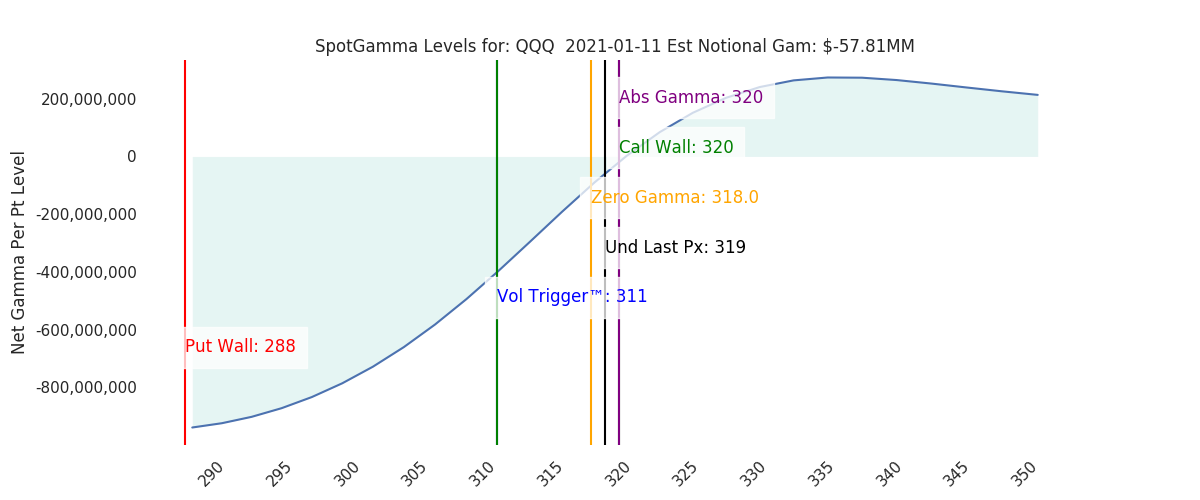
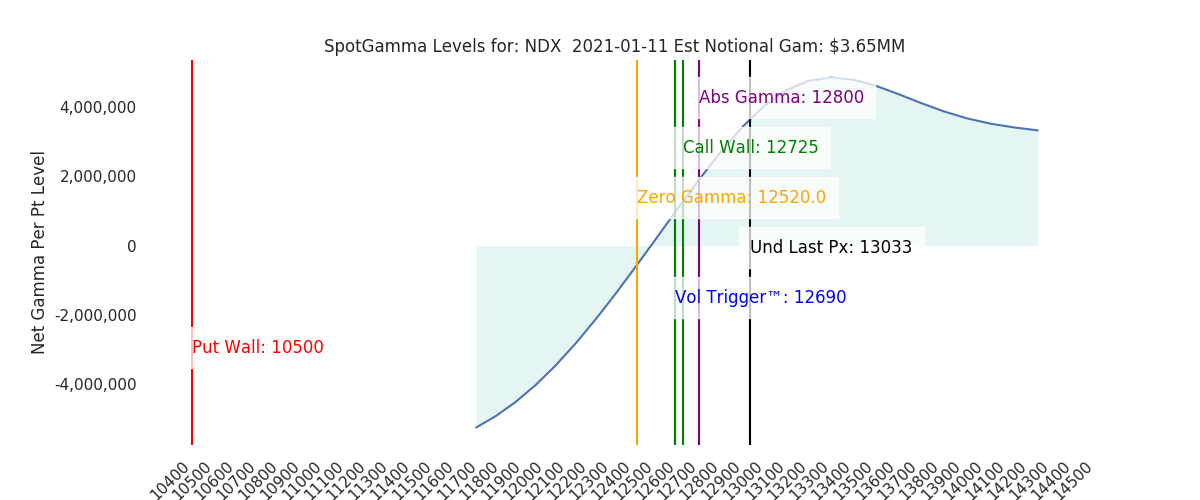
| Ref Price: | 3793 | 3821 | 379 | 13033 | 319 | ||
| VIX Ref: | 14 | 21.56 | |||||
| SG Gamma Index™: | 1.10 | 1.42 | 0.18 | 0.03 | -0.01 | ||
| Gamma Notional(MM): | $309.00 | $567.00 | $649.00 | $4.00 | $-58.00 | ||
| SGI Imp. 1 Day Move: | 0.61%, | 23.0 pts | Range: 3770.0 | 3816.0 | ||||
| SGI Imp. 5 Day Move: | 3793 | 2.05% | Range: 3715.0 | 3871.0 | ||||
| Zero Gamma Level(ES Px): | 3727 | 3727 | — | 0 | |||
| Vol Trigger™(ES Px): | 3735 | 3695 | 374 | 12690 | 311 | ||
| SG Abs. Gamma Strike: | 3700 | 3800 | 380 | 12800 | 320 | ||
| Put Wall Support: | 3550 | 3550 | 360 | 10500 | 288 | ||
| Call Wall Strike: | 3850 | 3800 | 385 | 12725 | 320 | ||
| CP Gam Tilt: | 1.69 | 1.57 | 1.26 | 1.45 | 0.94 | ||
| Delta Neutral Px: | 3580 | ||||||
| Net Delta(MM): | $1,100,220.00 | $1,098,023.00 | $171,904.00 | $35,886.00 | $65,793.00 | ||
| 25D Risk Reversal | -0.08 | -0.08 | -0.07 | -0.08 | -0.08 | ||
| Top Absolute Gamma Strikes: SPX: [3850, 3800, 3750, 3700] SPY: [385, 380, 375, 370] QQQ: [320, 315, 310, 300] NDX:[13000, 12800, 12725, 12600] SPX Combo: [3819.0, 3868.0, 3769.0, 3792.0, 3838.0] NDX Combo: [13071.0, 13280.0, 12654.0] The Volatility Trigger has moved UP: 3735 from: 3695 The Call Wall has moved to: 3850 from: 3800 SPX resistance is: 3850. Support is: 3700 .Reference ‘Intraday Support’ levels for support areas. The total gamma has moved DOWN: $309.06MM from: $566.00MM Positive gamma is moderate which should lead to smaller market moves. Average Range on day is 1.5% |

| Sub Login Follow @SpotGamma Strike Charts Historical Chart Gamma Expiration Tool |
| ©TenTen Capital LLC d.b.a. SpotGamma Please leave us a review: Click Here |
| See the FAQ for more information on reading the SpotGamma graph. |
| SpotGamma provides this information for research purposes only. It is not investment advice. SpotGamma is not qualified to provide investment advice, nor does it guarantee the accuracy of the information provided. This email is intended solely for subscribers, please do not distribute the information without the express written consent of SpotGamma.com. |
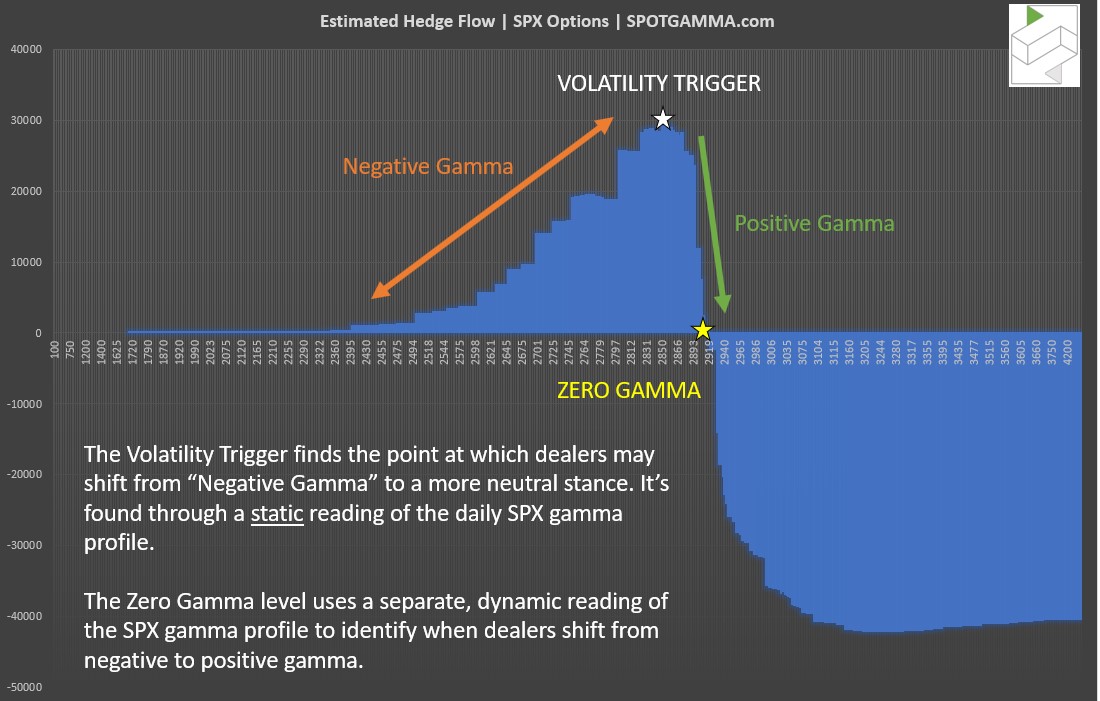
| SPX Ref: Estimated ES Futures price at which data was run. VIX Ref: Estimated VIX price at which data was run. SG Gamma Index: Proprietary gamma modeling index value. Combo Strike™: A combination of SPY/SPY open interest, then “price normalized” back to the SPX Gamma Notional: Estimated amount of notional gamma based on traditional gamma modeling. SG Imp. 1SD Move: For one day ahead it is the projected 1 standard deviation SPX move implied by the SG Gamma Index. High Gamma Strike: Strike with the highest level of net positive gamma. Seen as a resistance level. Top Absolute Gamma Strike: Level with most call gamma + put gamma. Zero Gamma Strike: Estimated level at which gamma flips from positive (above strike) to negative (below strike). Volatility Trigger™: Similar to Zero Gamma in that its a level at which dealers may shift from positive (above trigger) to negative (below strike). Click here for a Zero Gamma vs Volatility Trigger Diagram Put Wall Strike: Strike with largest level of put gamma. Seen as a general support area. CP Gamma tilt: Call gamma to put gamma ratio. Extreme readings may show skewed investor sentiment. Delta Neutral Strike: Estimate where the options market may price the delta neutral level. This is NOT model adjusted meaning that we make no assumption on dealer positioning. 25 D Risk Reversal: A measurement of the 25 delta call minus 25 delta put on a ~30 day rolling basis. Used to measure call values relative to puts. |
