Options Expirations Remove Supportive Positions and Create Downside Risk
Daily Note:
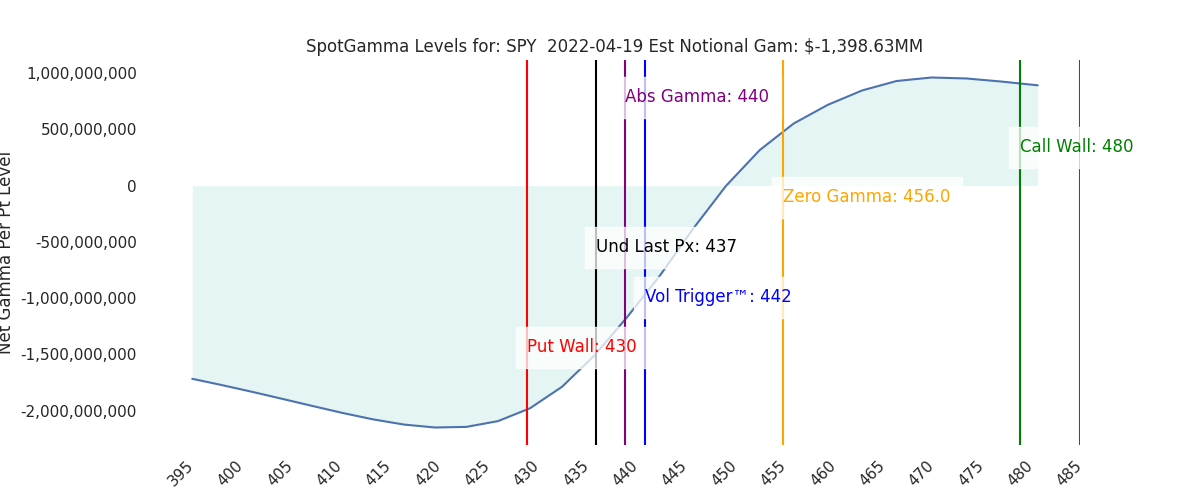
Futures have pressed lower to 4380. Our levels and volatility expectations remain in line with yesterday’s data. We look for a maximum move of 1.19% (open/close) with resistance at 4400SPX & 440SPY (4415SPX equivalent). Support shows at 4365SPX (435SPY). Beneath that level we see 4300 as next support.
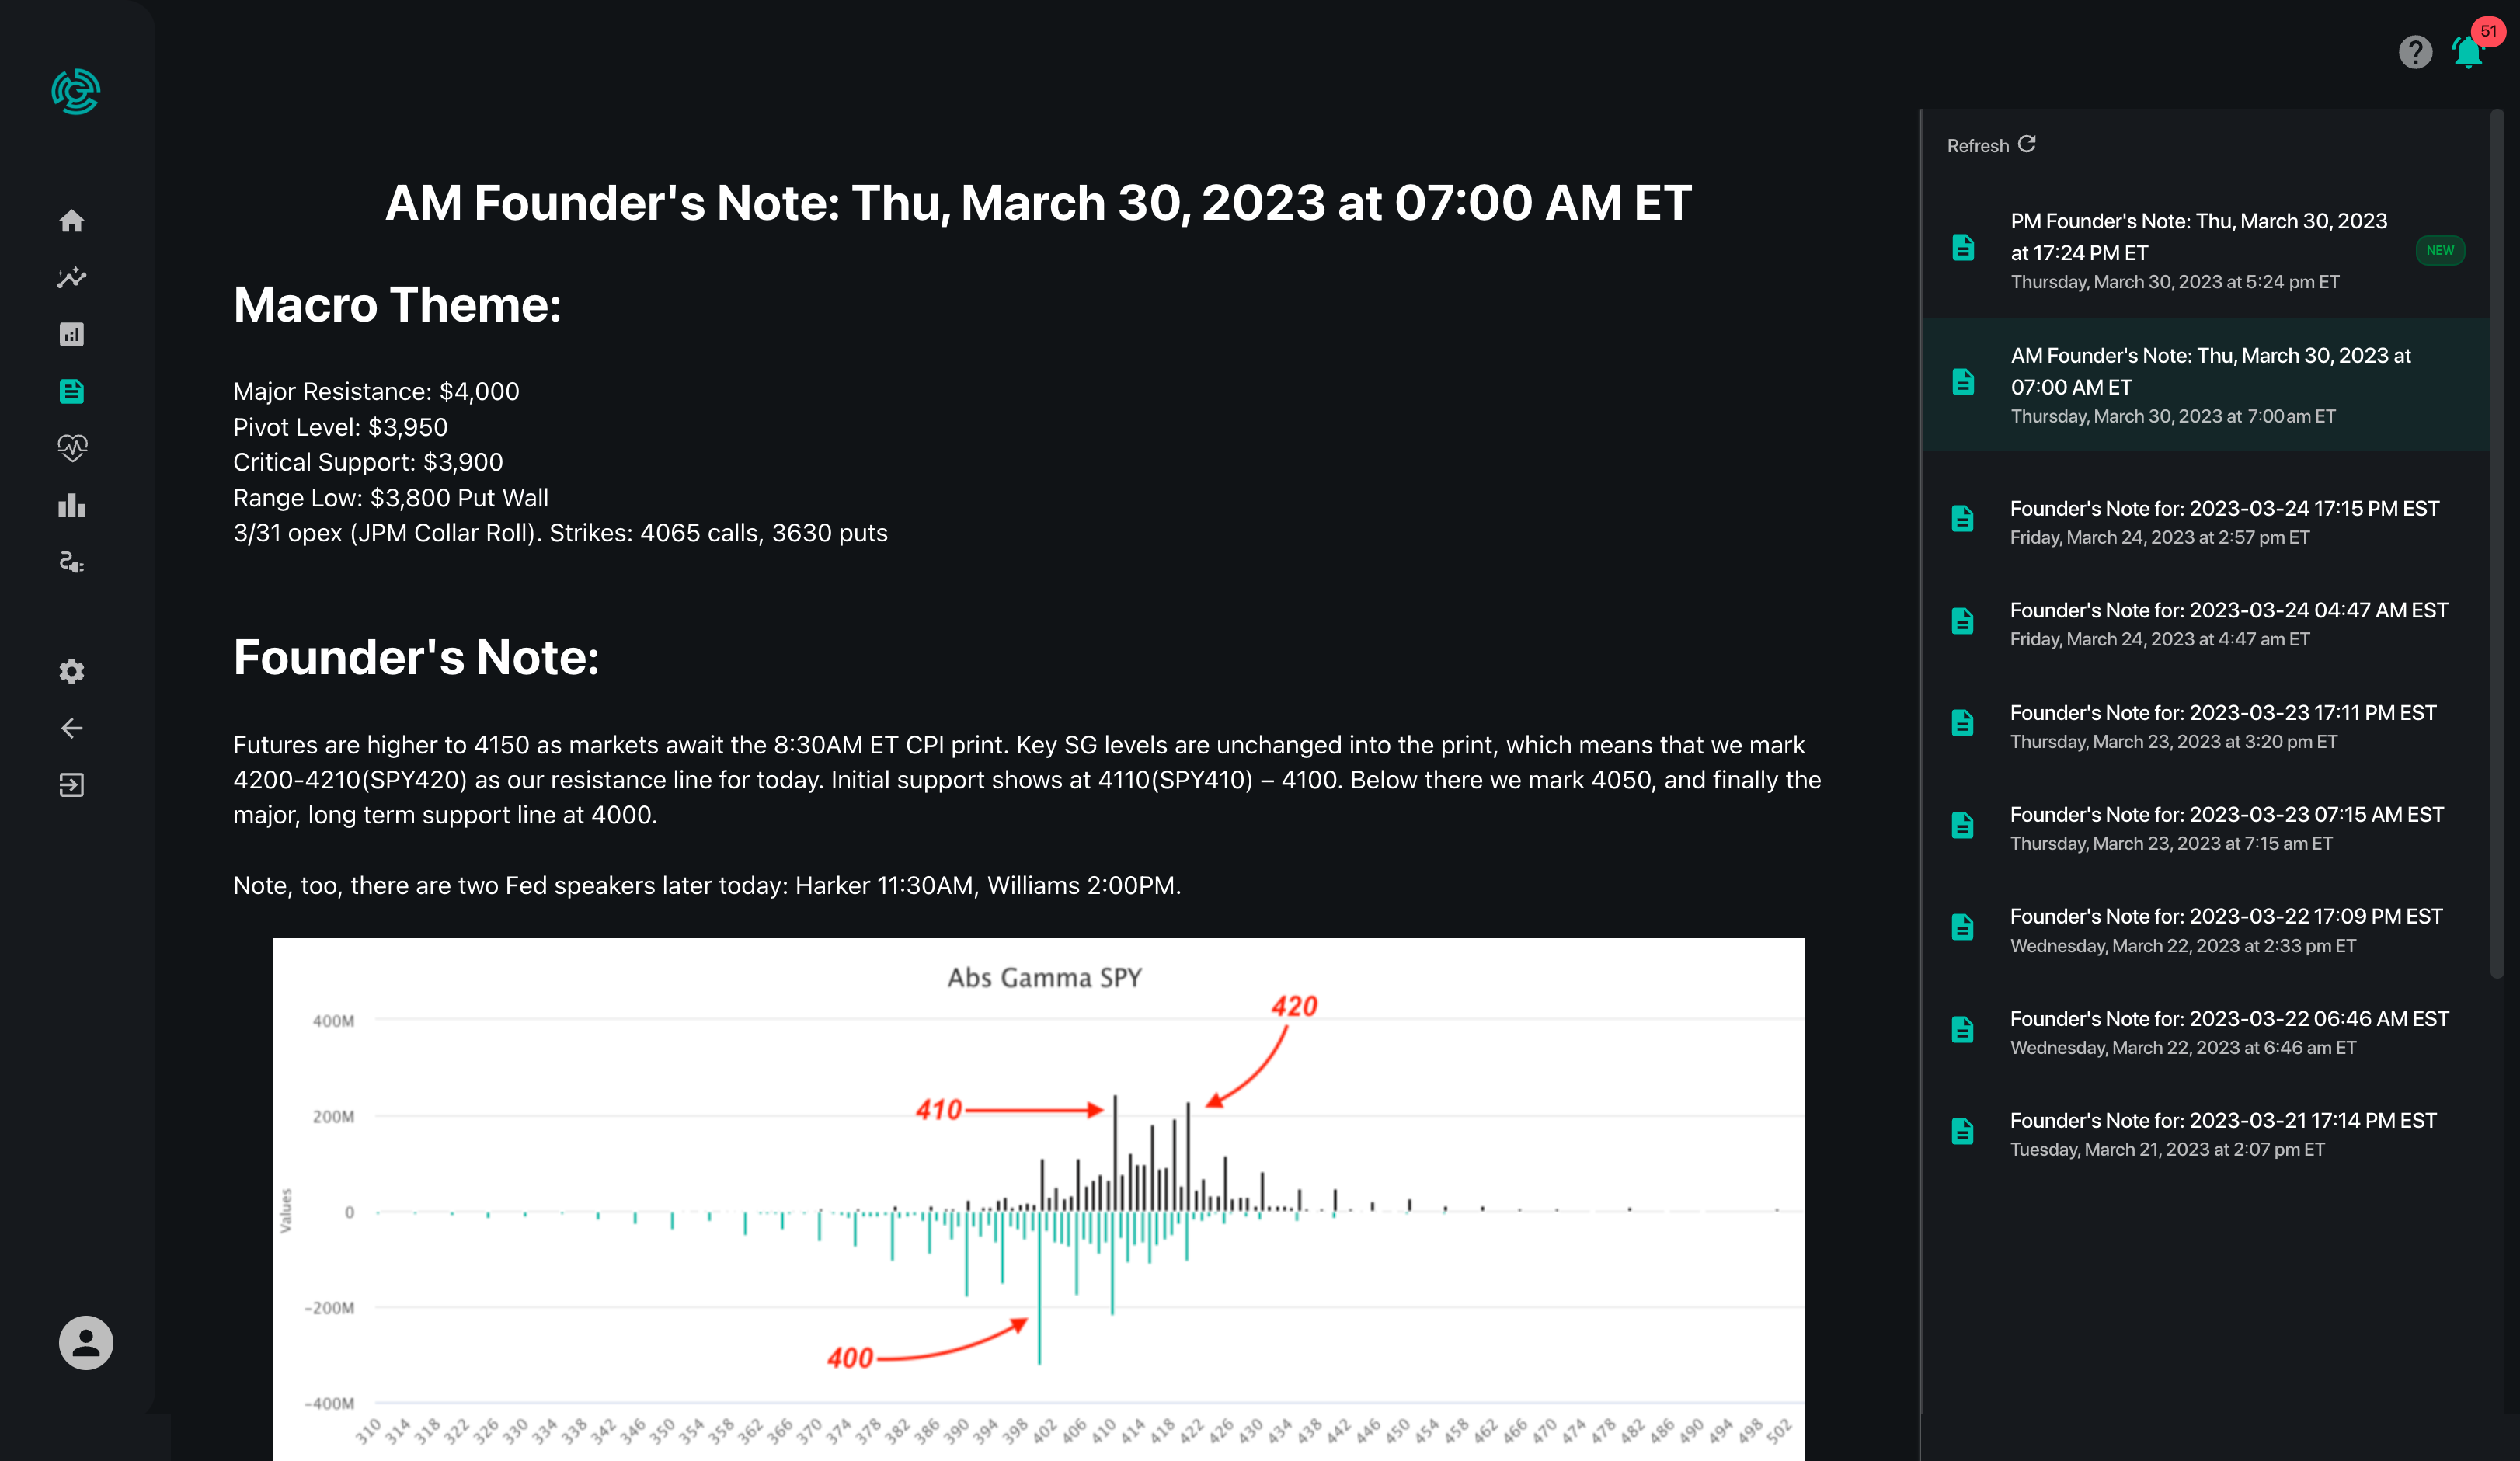
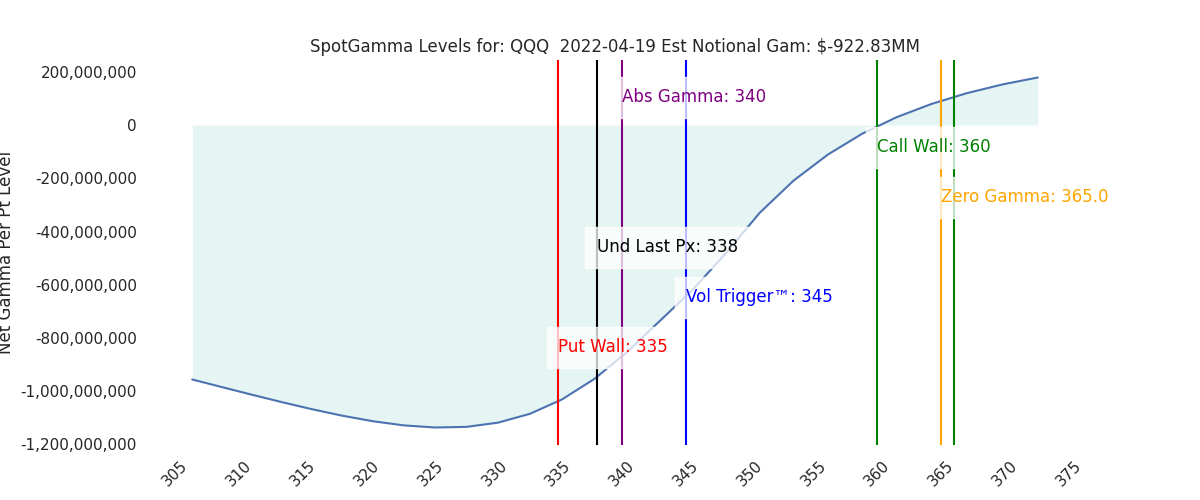
Additionally, we flagged heavy negative delta trading yesterday in SPY/QQQ which has led to a +10-20% increase in negative gamma for those ETF’s. This implies higher rates of potential volatility.
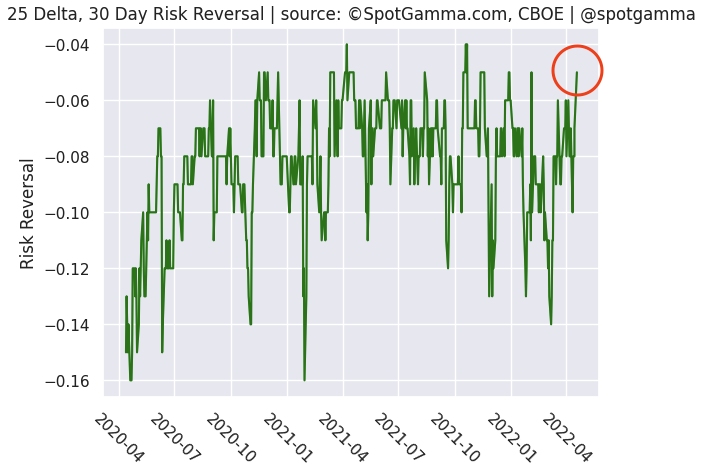
The market appears to be generally accepting these lower prices without much fear. This morning our risk reversal metric measures -0.05 which is typically a level associated with large bullish moves in equities. This indicates an increase in call options prices, despite call volumes (i.e. demand) not increasing. Our initial thought is that this is due to dealer pricing of FOMC meeting in early May. The other implication is that puts may be relatively cheap.
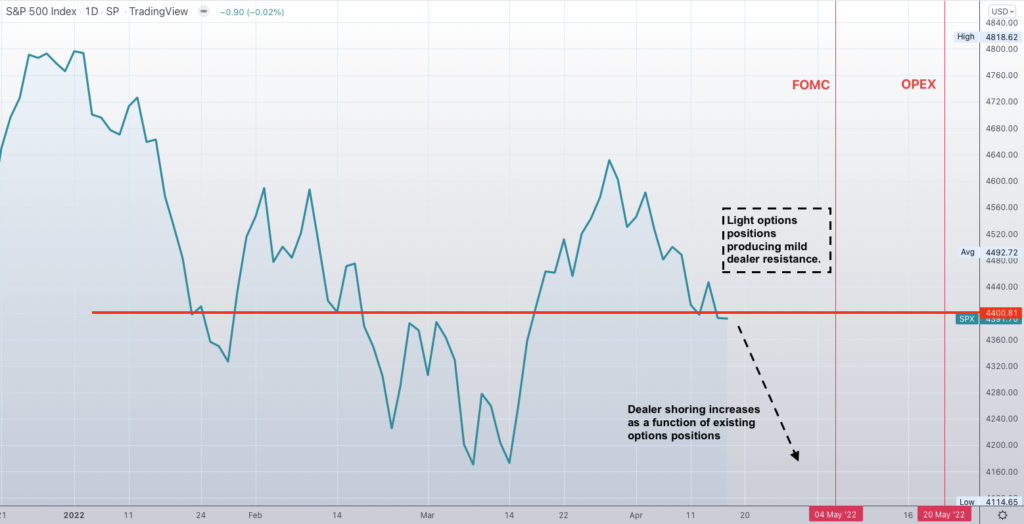
Overall it seems that the market has reached something of an exhaustion equilibrium. At this point traders have had the opportunity to price in both fiscal/monetary & geopolitical risks and sell accordingly. It’s also clear that the tail risk remains elevated, and that keeps the VIX elevated. The issue for markets here is that if the S&P slides lower, it’s likely dealer shorting starts to increase incrementally.
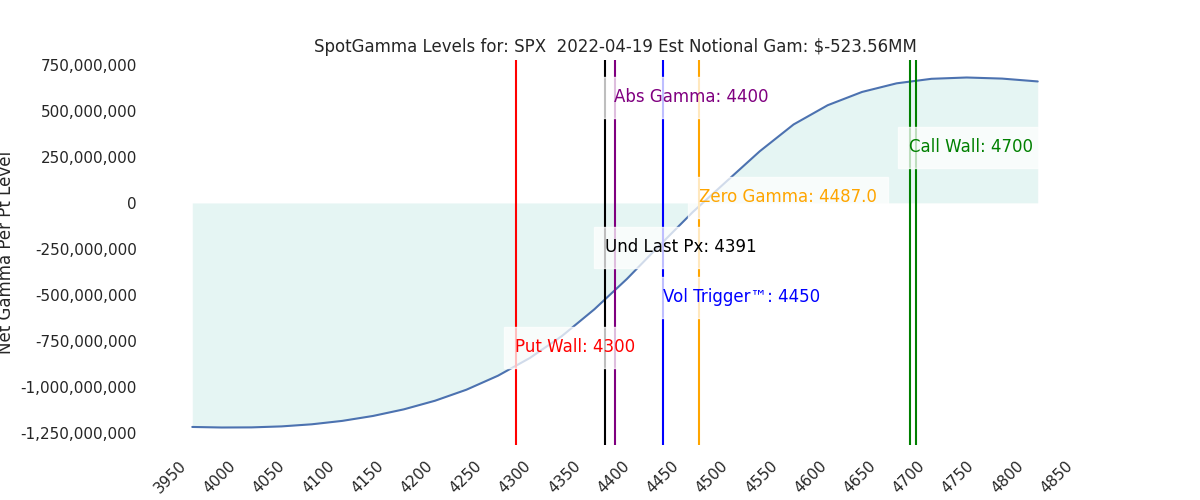
There is a fair amount of both calls & puts at 440/4400 which, by default, produces mean-reverting action into this strike. However, a sharp enough test lower may spur enough dealer short hedging to break the market to the downside and a quick test of the 4300 level. In this case, it could be something that would typically be easily absorbed by markets, like an hawkish Fed comment.
If a downside cycle initiates from here, it creates a reflexive feedback loop wherein dealers are selling which drives higher implied volatility and more downside demand. Further, the two events ahead that could break a cycle like this would be 5/4 (FOMC) and May OpEX (5/20).
We think its in these scenarios wherein the market is misplacing the risk of downside moves (i.e. the risk reversal metric above) due to dealer positioning.
If this was a market with a high positive gamma position, then you would have extra “padding” via dealer buying to absorb price dips. However, in this case (because we’re below the Vol Trigger/Zero Gamma) dealers may need to start selling into lower market prices.
We think that upside risks to the upside continue to remain muted, as significant volatility selling likely cannot commence without clarity from the Fed and/or a resolution of geopolitical risks (i.e. a Russian/Ukraine ceasefire).
| SpotGamma Proprietary Levels | Latest Data | Previous | SPY | NDX | QQQ |
|---|---|---|---|---|---|
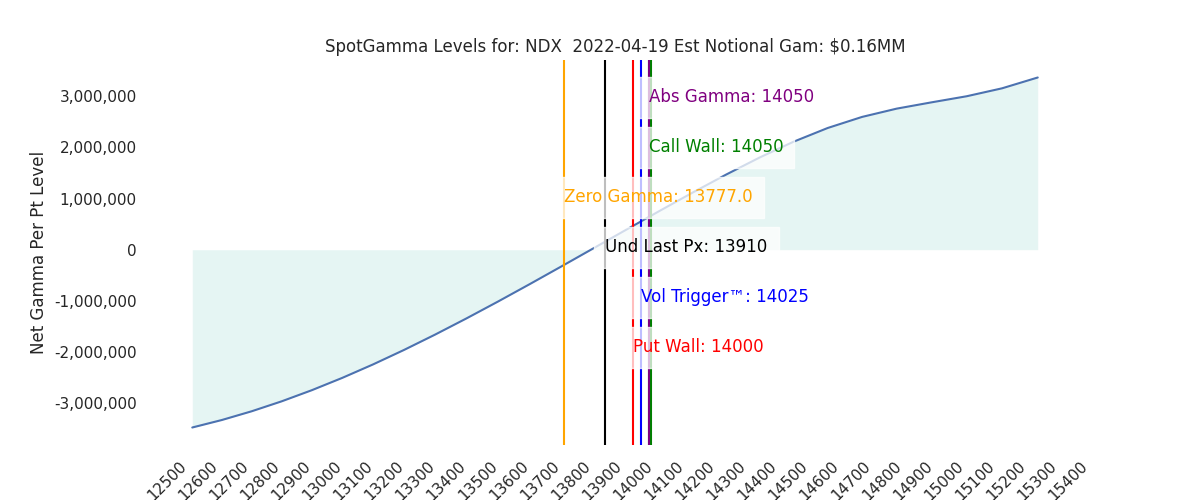
| Ref Price: | 4391 | 4392 | 437 | 13910 | 338 |
| SpotGamma Imp. 1 Day Move: Est 1 StdDev Open to Close Range | 1.19%, | (±pts): 52.0 | VIX 1 Day Impl. Move:1.41% | ||
| SpotGamma Imp. 5 Day Move: | 2.91% | 4392 (Monday Ref Px) | Range: 4265.0 | 4520.0 | ||
| SpotGamma Gamma Index™: | -0.95 | -1.07 | -0.32 | 0.00 | -0.16 |
| Volatility Trigger™: | 4450 | 4450 | 442 | 14025 | 345 |
| SpotGamma Absolute Gamma Strike: | 4400 | 4400 | 440 | 14050 | 340 |
| Gamma Notional(MM): | -524.0 | -540.64 | -1399.0 | 0.0 | -923.0 |
| Additional Key Levels | Latest Data | Previous | SPY | NDX | QQQ |
|---|---|---|---|---|---|
| Zero Gamma Level: | 4487 | 4487 | 0 | 0 | 0 |
| Put Wall Support: | 4300 | 4300 | 430 | 14000 | 335 |
| Call Wall Strike: | 4700 | 4750 | 480 | 14050 | 360 |
| CP Gam Tilt: | 0.74 | 0.68 | 0.51 | 1.02 | 0.45 |
| Delta Neutral Px: | 4402 | ||||
| Net Delta(MM): | $1,368,783 | $1,352,369 | $141,962 | $38,369 | $91,254 |
| 25D Risk Reversal | -0.05 | -0.07 | -0.06 | -0.07 | -0.06 |
| Call Volume | 269,924 | 1,115,216 | 4,803 | 560,895 | |
| Put Volume | 633,625 | 1,499,884 | 16,241 | 832,855 | |
| Call Open Interest | 4,477,898 | 4,900,449 | 41,407 | 3,021,039 | |
| Put Open Interest | 8,703,084 | 9,339,120 | 42,984 | 5,870,480 |
| Key Support & Resistance Strikes: |
|---|
| SPX: [4500, 4450, 4400, 4300] |
| SPY: [450, 440, 435, 430] |
| QQQ: [350, 340, 335, 330] |
| NDX:[15000, 14500, 14050, 14000] |
| SPX Combo (strike, %ile): [4299.0, 4352.0, 4400.0, 4361.0, 4313.0] |
| SPY Combo: [428.77, 434.03, 438.85, 434.9, 430.09] |
| NDX Combo: [13758.0, 13549.0, 13966.0, 14050.0, 13674.0] |
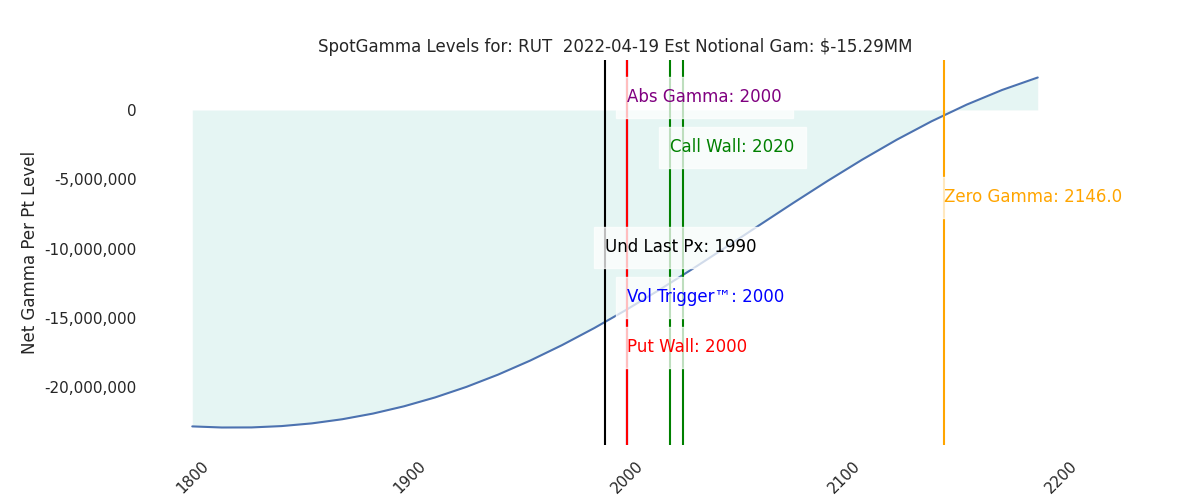
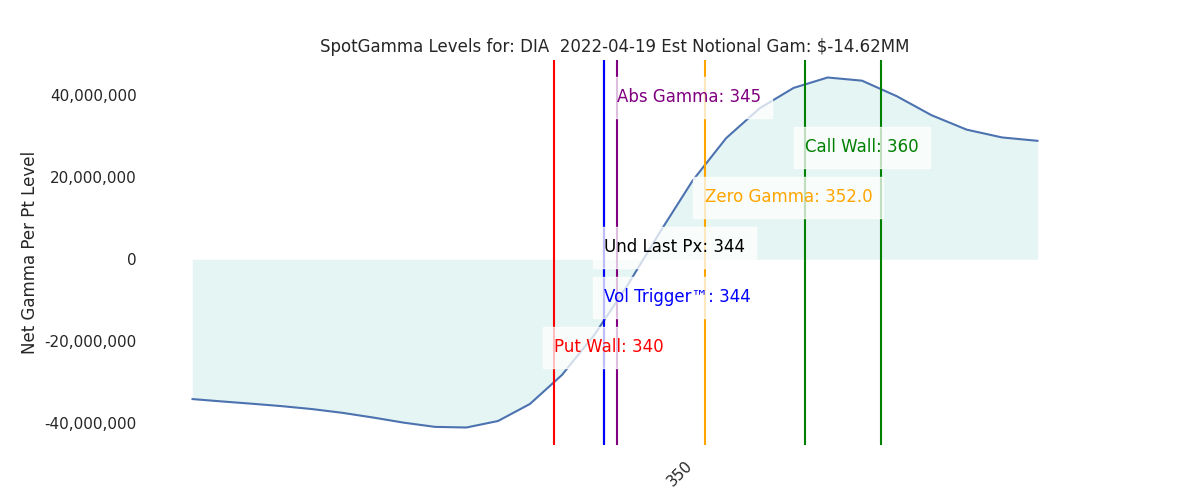
| ©TenTen Capital LLC d.b.a. SpotGamma Please leave us a review: Click Here |
| See the FAQ for more information on reading the SpotGamma graph. |
| SpotGamma provides this information for research purposes only. It is not investment advice. SpotGamma is not qualified to provide investment advice, nor does it guarantee the accuracy of the information provided. This email is intended solely for subscribers, please do not distribute the information without the express written consent of SpotGamma.com. |