Daily Note:
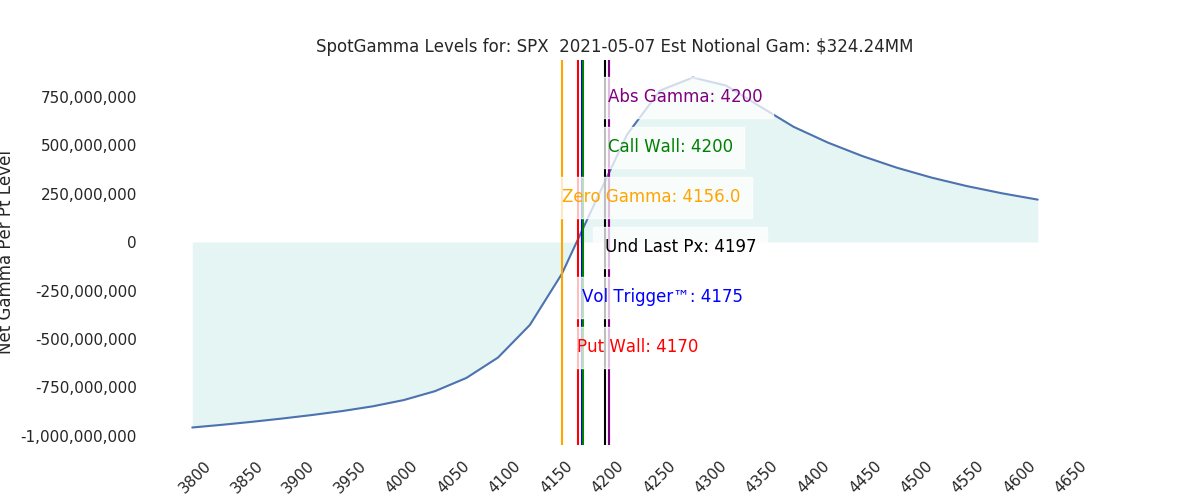
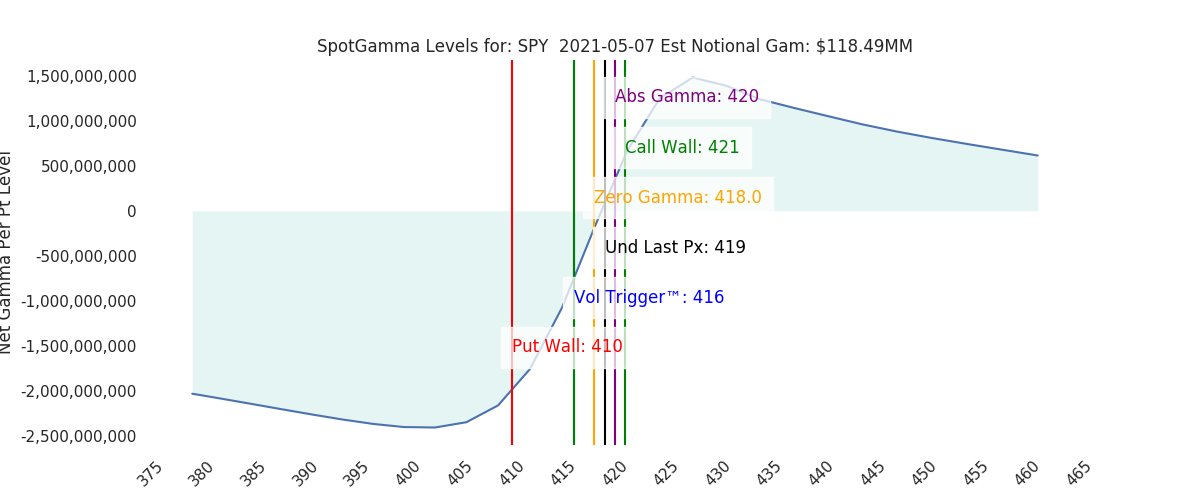
Futures have pushed through to 4203 just ahead of this mornings 8:30AM EST jobs report. Our Call Wall resistance point did not move higher, and stands at 4200. The SPY Call Wall is 421, and so we draw a large Combo resistance point at 4215. Support shows at 4175, with a max SpotGamma implied move of 68bps. Note that we now have some “positive gamma cushion” in the SPX which reduces some of the volatility risk we’ve been highlighting. If markets push toward 4250 positive gamma picks up substantially, which further reduces volatility risk.
Todays expiration did pick up a bit in size over the last few days. We show just under 20% of S&P/QQQ gamma expiring at the close (we generally mark anything >20% as “material”).
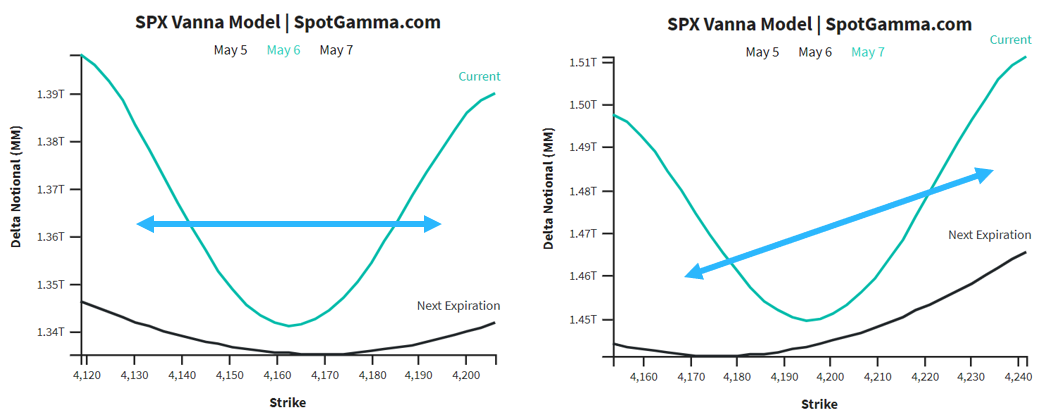
Its interesting to compare the vanna models (FAQ) in the SPX from yesterday to today. You can see that it was a fairly neutral stance yesterday, but now it has shifted toward a “sell skew” to the upside. This is because markets have pushed into a zone with higher call interest and dealers that are long calls have futures to short.
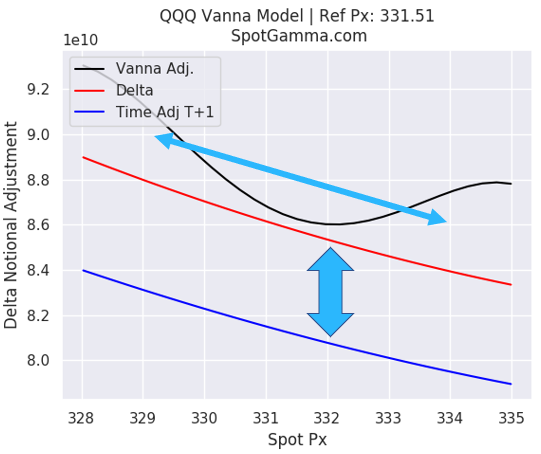
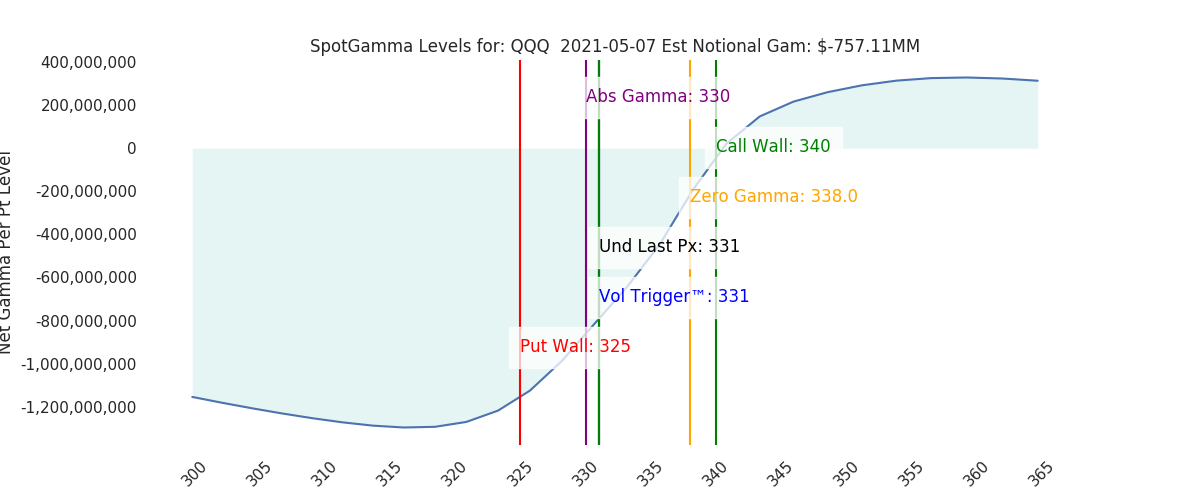
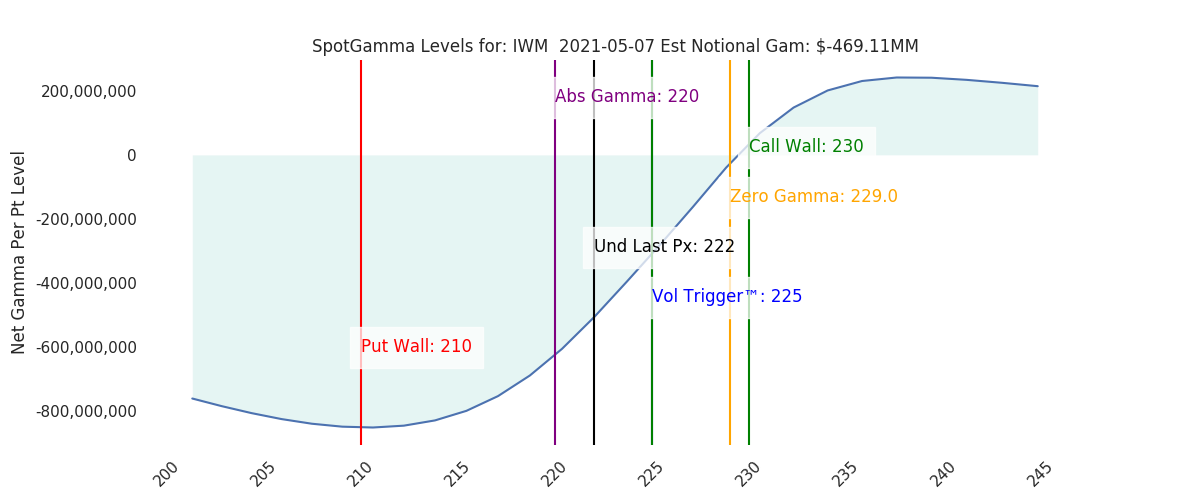
The QQQ/tech complex still holds a lot of puts & negative gamma, which should invoke high volatility today. We mark 330 as support, and remind NQ/QQQ traders to respect the “vanna”, as implied volatility has such a large impact on puts. If markets do decide to rally today, you may get more upside in QQQ/IWM vs S&P because of that negative gamma position.
This is highlighted in the vanna model for QQQ, shown below. You can see the skew is the opposite of that of the SPX, wherein dealers may have to buy back futures if QQQ rallies. Additionally we show a fairly impactful expiration (blue vs red line) which suggest that tonight’s expiration creates some additional dealer buying flows into Monday (side note: QQQ will be added to the vanna page in the next few days).
Model Overview:
4100-4215 is the range into May OPEX. Gamma is currently high which should lead to low volatility. As long as markets are >4170 we anticipate a low volatility market which grinds higher.
| SpotGamma Proprietary Levels | Latest Data | Previous | SPY | NDX | QQQ |
|---|---|---|---|---|---|
| Ref Price: | 4197 | 4194 | 419 | 13629 | 331 |
| SpotGamma Imp. 1 Day Move: | .68%, | 28.8 pts | Range: 4169| 4225 | ||
| SpotGamma Imp. 5 Day Move: | 4185 | 6.64% | Range: 3907.0 | 4463.0 | ||
| SpotGamma Gamma Index™: | 1.37 | 0.43 | 0.09 | -0.00 | -0.13 |
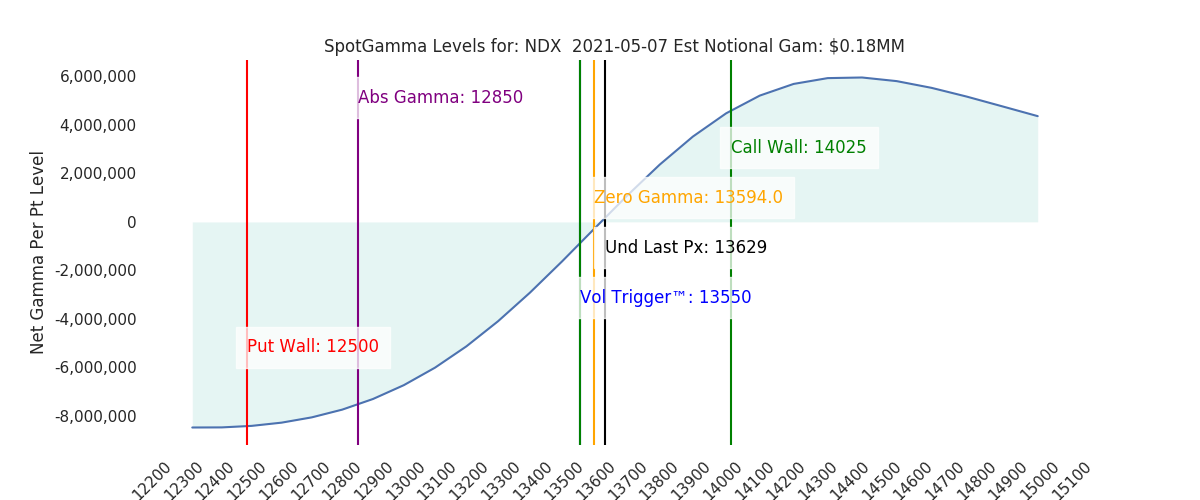
| Volatility Trigger™(ES Px): | 4175 | 4175 | 416 | 13550 | 331 |
| SpotGamma Absolute Gamma Strike: | 4200 | 4200 | 420 | 12850 | 330 |
| Gamma Notional(MM): | $324 | $311 | $118 | $0 | $-757 |
| Additional Key Levels | Latest Data | Previous | SPY | NDX | QQQ |
|---|---|---|---|---|---|
| Zero Gamma Level(ES Px): | 4156 | 4153 | 0 | 0 | 0 |
| Put Wall Support: | 4170 | 4000 | 410 | 12500 | 325 |
| Call Wall Strike: | 4200 | 4200 | 421 | 14025 | 340 |
| CP Gam Tilt: | 1.46 | 1.21 | 1.03 | 1.01 | 0.62 |
| Delta Neutral Px: | 3992 | ||||
| Net Delta(MM): | $1,400,958 | $1,308,846 | $202,897 | $40,341 | $84,011 |
| 25D Risk Reversal | -0.07 | -0.08 | -0.06 | -0.08 | -0.07 |
| Top Absolute Gamma Strikes: |
|---|
| SPX: [4200, 4175, 4150, 4000] |
| SPY: [420, 418, 417, 415] |
| QQQ: [335, 330, 325, 320] |
| NDX:[14025, 14000, 13750, 12850] |
| SPX Combo: [4197.0, 4248.0, 4222.0, 4206.0, 4227.0] |
| NDX Combo: [13344.0, 13548.0, 13467.0, 13753.0, 13971.0] |
| Sub Login Support Follow @SpotGamma Strike Charts Historical Chart Gamma Expiration Tool |
| ©TenTen Capital LLC d.b.a. SpotGamma Please leave us a review: Click Here |
| See the FAQ for more information on reading the SpotGamma graph. |
| SpotGamma provides this information for research purposes only. It is not investment advice. SpotGamma is not qualified to provide investment advice, nor does it guarantee the accuracy of the information provided. This email is intended solely for subscribers, please do not distribute the information without the express written consent of SpotGamma.com. |