Daily Note:
More choppy action in futures overnight which hit overnight highs of 4389 (~4400 SPX equivalent) before dropping back to last nights close of 4365. Due to it being the quarter end OPEX, we expect volatile action similar to yesterday. 4400 is major resistance, with 4361 support.
There is a decent chunk of index/etf gamma expiring today and tomorrow, and the majority of that is put gamma. We theorize that these chunky puts (of which dealers are likely short) invoke a lot of short gamma hedging which leads to this jumpy/choppy action. As we remarked last night, there were 3x 30 handle swings in the SPX yesterday from ~4355 to 4385. New puts aren’t being added, so there aren’t deltas to add, just gamma adjustments. As puts expire, particularly with QQQ (more “put heavy”) that can generate a tail wind for equities as short deltas are unwound.
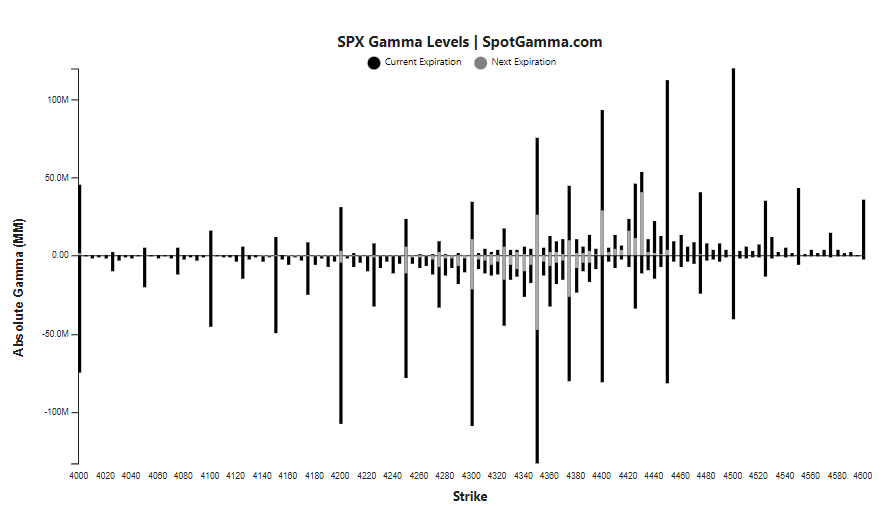
Without a macro shock it seems like this market is poised for a response to the upside (put expiry, high implied volatility deflating), and our signal for a push higher would be a recovery of the 4400 line. Beneath that 4400 line risk remains high due to the large put positions which can invoke a negative gamma downdraft.
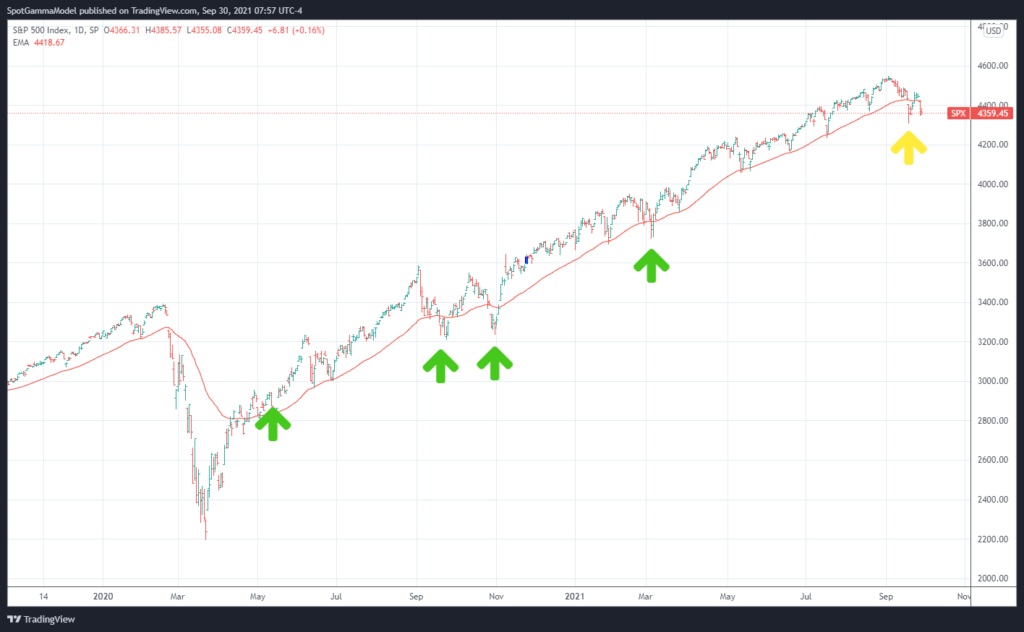
We do make note of things being different this time. The default response of every dip since March of ’20 has been aggressive buying/volatility shorting. Its surprising that the market is unable to catch that bid, given that this current setup would seem like a “fat pitch” for those short dated vol sellers.
While we generally leave technical analysis to the professionals, the chart below highlights our point. Using the 50 day as a drawdown barometer, you can see how quickly the “buy the dip” response is. On this recent decline there was a tepid attempt, but that bid has receded. What happens next is unclear, but (as noted above) our view is not: we’re bullish above 4400 and bearish below.
Model Overview:
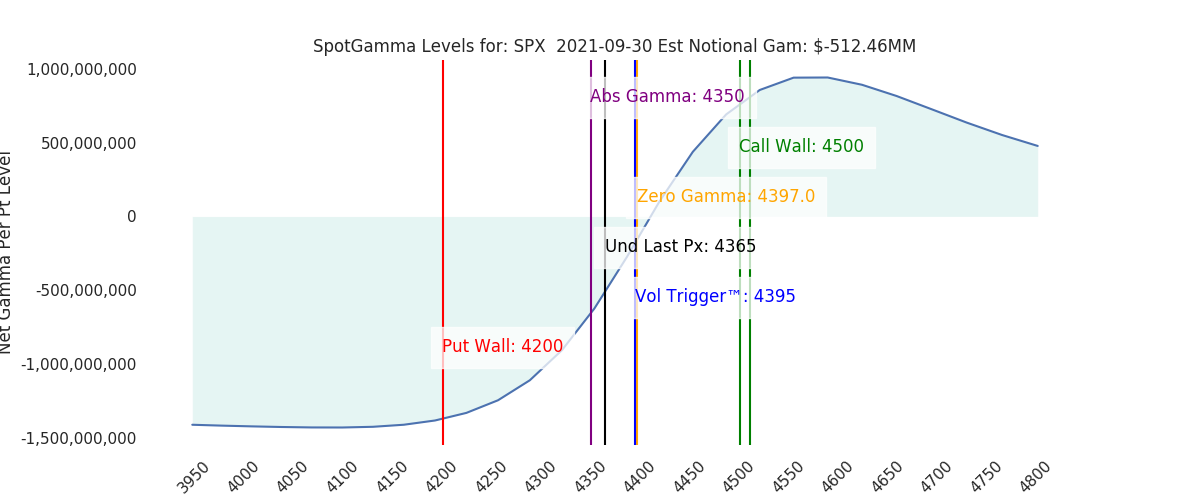
4400 resistance. High volatility and high risk as long as the SPX is <4400.
| SpotGamma Proprietary Levels | Latest Data | Previous | SPY | NDX | QQQ |
|---|---|---|---|---|---|
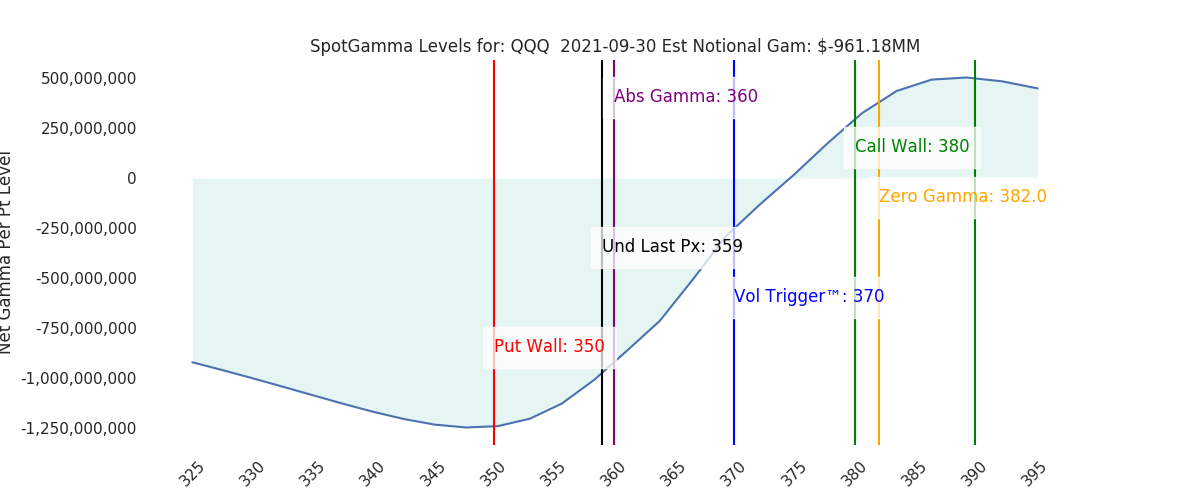
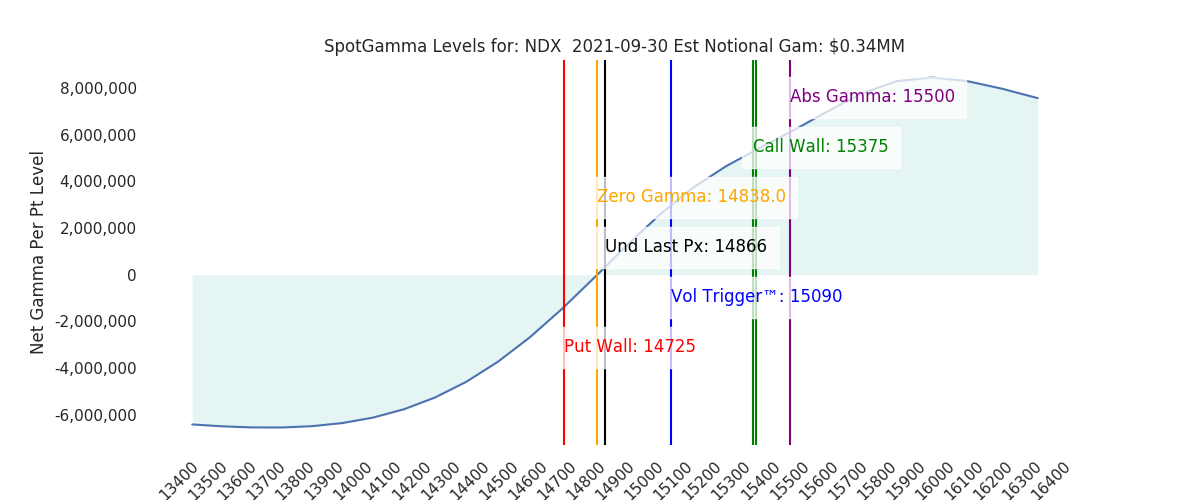
| Ref Price: | 4386 | 4356 | 434 | 14866 | 359 |
| SpotGamma Imp. 1 Day Move: | 2.65%, | 116.0 pts | Range: 4368.0 | 4404.0 | ||
| SpotGamma Imp. 5 Day Move: | 2.39% | 4441 (Monday Ref Px) | Range: 4335.0 | 4547.0 | ||
| SpotGamma Gamma Index™: | -1.15 | -0.10 | -0.37 | -0.01 | -0.20 |
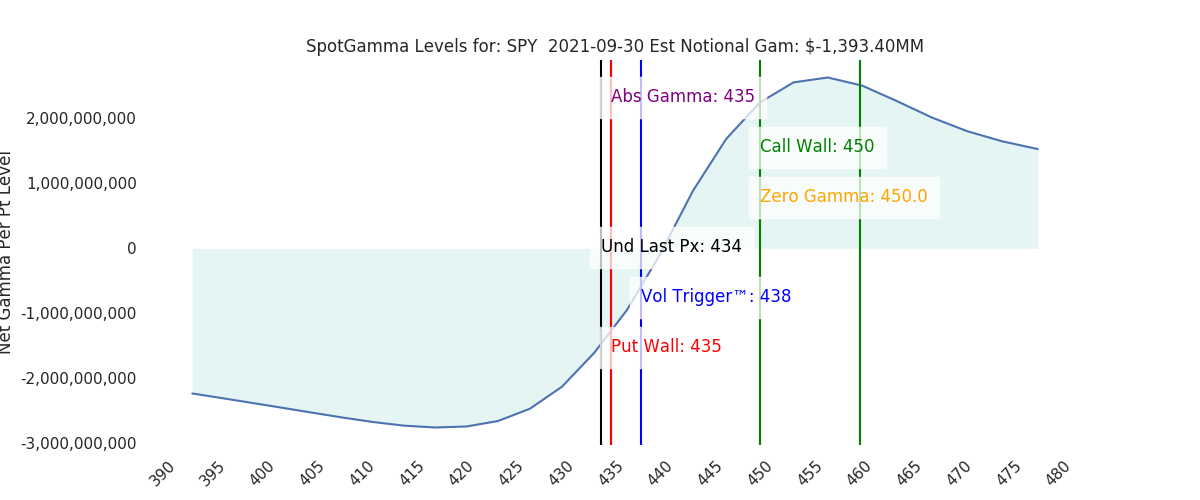
| Volatility Trigger™: | 4395 | 4415 | 438 | 15090 | 370 |
| SpotGamma Absolute Gamma Strike: | 4400 | 4400 | 435 | 15500 | 360 |
| Gamma Notional(MM): | $-512 | $-620 | $-1,393 | $0 | $-961 |
| Additional Key Levels | Latest Data | Previous | SPY | NDX | QQQ |
|---|---|---|---|---|---|
| Zero Gamma Level: | 4397 | 4395 | 0 | 0 | 0 |
| Put Wall Support: | 4200 | 4200 | 435 | 14725 | 350 |
| Call Wall Strike: | 4500 | 4500 | 450 | 15375 | 380 |
| CP Gam Tilt: | 0.73 | 0.7 | 0.67 | 1.03 | 0.52 |
| Delta Neutral Px: | 4235 | ||||
| Net Delta(MM): | $1,397,128 | $1,373,470 | $179,735 | $43,582 | $94,581 |
| 25D Risk Reversal | -0.09 | -0.1 | -0.08 | -0.09 | -0.08 |
| Key Support/Resistance Strikes: |
|---|
| SPX: [4500, 4450, 4400, 4350] |
| SPY: [440, 438, 435, 430] |
| QQQ: [370, 365, 360, 350] |
| NDX:[15500, 15375, 15000, 14000] |
| SPX Combo: [4309, 4361, 4261,4326,4374] |
| SPY Combo: [428.37, 433.58, 423.59,430.1] |
| NDX Combo: [14470.0, 14885.0, 14796.0, 14677.0, 14633.0] |
| ©TenTen Capital LLC d.b.a. SpotGamma Please leave us a review: Click Here |
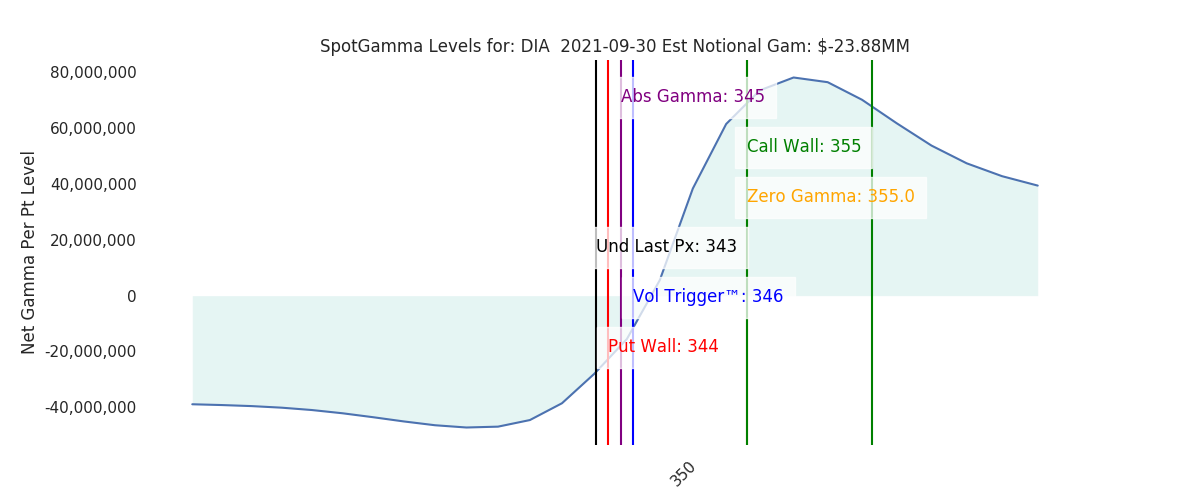
| See the FAQ for more information on reading the SpotGamma graph. |
| SpotGamma provides this information for research purposes only. It is not investment advice. SpotGamma is not qualified to provide investment advice, nor does it guarantee the accuracy of the information provided. This email is intended solely for subscribers, please do not distribute the information without the express written consent of SpotGamma.com. |