• Skip to content
  • Skip to primary sidebar

SpotGamma™

S&P 500 Stock Market Gamma Trading Levels Based on Options Open Interest

  • Subscribe Now
  • Products
  • Blog
  • FAQ
  • Contact
    • About
  • Members
    • Account
    • Portal
    • Equity Hub 2.0

Feb 25 2020

Gamma Tilt & Market Bottoms

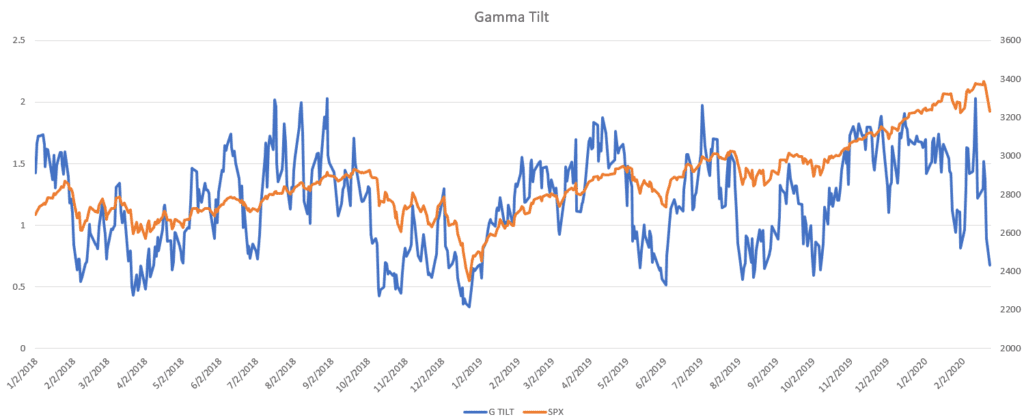
One of the indicators we watch for a potential bottom is Gamma Tilt – or the ratio of call gamma to put gamma. When this level hits lows it may be an indication that the market is oversold. Currently the S&P500 Index is about 8% in ~5 trading days.

Here is the current indicator for the SPX Gamma Tilt on 2/25/20, and as you can see it is approaching lows which can be found at recent market bottoms. It should be noted that the 2 year history of this particular indicator was during a strong bull market and that may skew results.

The forward 5 day return of buying SPX when the indicator <.5 is ~50bps. The 10 day is ~100bps, but its an admittedly small sample set.

spx gamma tilt chart
SPX Gamma Tilt Indicator
  • Click to share on Twitter (Opens in new window)
  • Click to share on Facebook (Opens in new window)
  • Click to share on LinkedIn (Opens in new window)
  • Click to share on Reddit (Opens in new window)

Written by Spot Gamma · Categorized: Market Analysis · Tagged: February 2020 crash, gamma tilt, oversold indicator

Primary Sidebar

Popular Posts

spotgamma-sidebar-weaponized-gamma-sidebar
spotgamma-sidebar-yolo-trade
did-softbank-weaponize-options-gamma-whale
goldman-gamma-op-ex-option-driven-equity-flow
spotgamma-on-the-market-huddle

Categories

  • Dark Pool (1)
  • Market Analysis (262)
  • SpotGamma Updates (4)
  • Stock (47)
  • Trade (3)
Follow @spotgamma on Twitter!
  • Subscribe
  • Disclaimer
  • Account
  • Portal

©2021 TenTen Capital LLC DBA SpotGamma