U.S. equities surged on May 12, 2025, as the S&P 500 closed +3% to 5,848, with intraday action reflecting a more modest 0.23% gain, after the U.S. and China agreed to a significant 90-day reduction in reciprocal tariffs.
What did any of this have to do with 0DTE SPX options?
Hint: The 0.23% intraday gain.
The Anatomy of an SPX 0DTE Driven Market
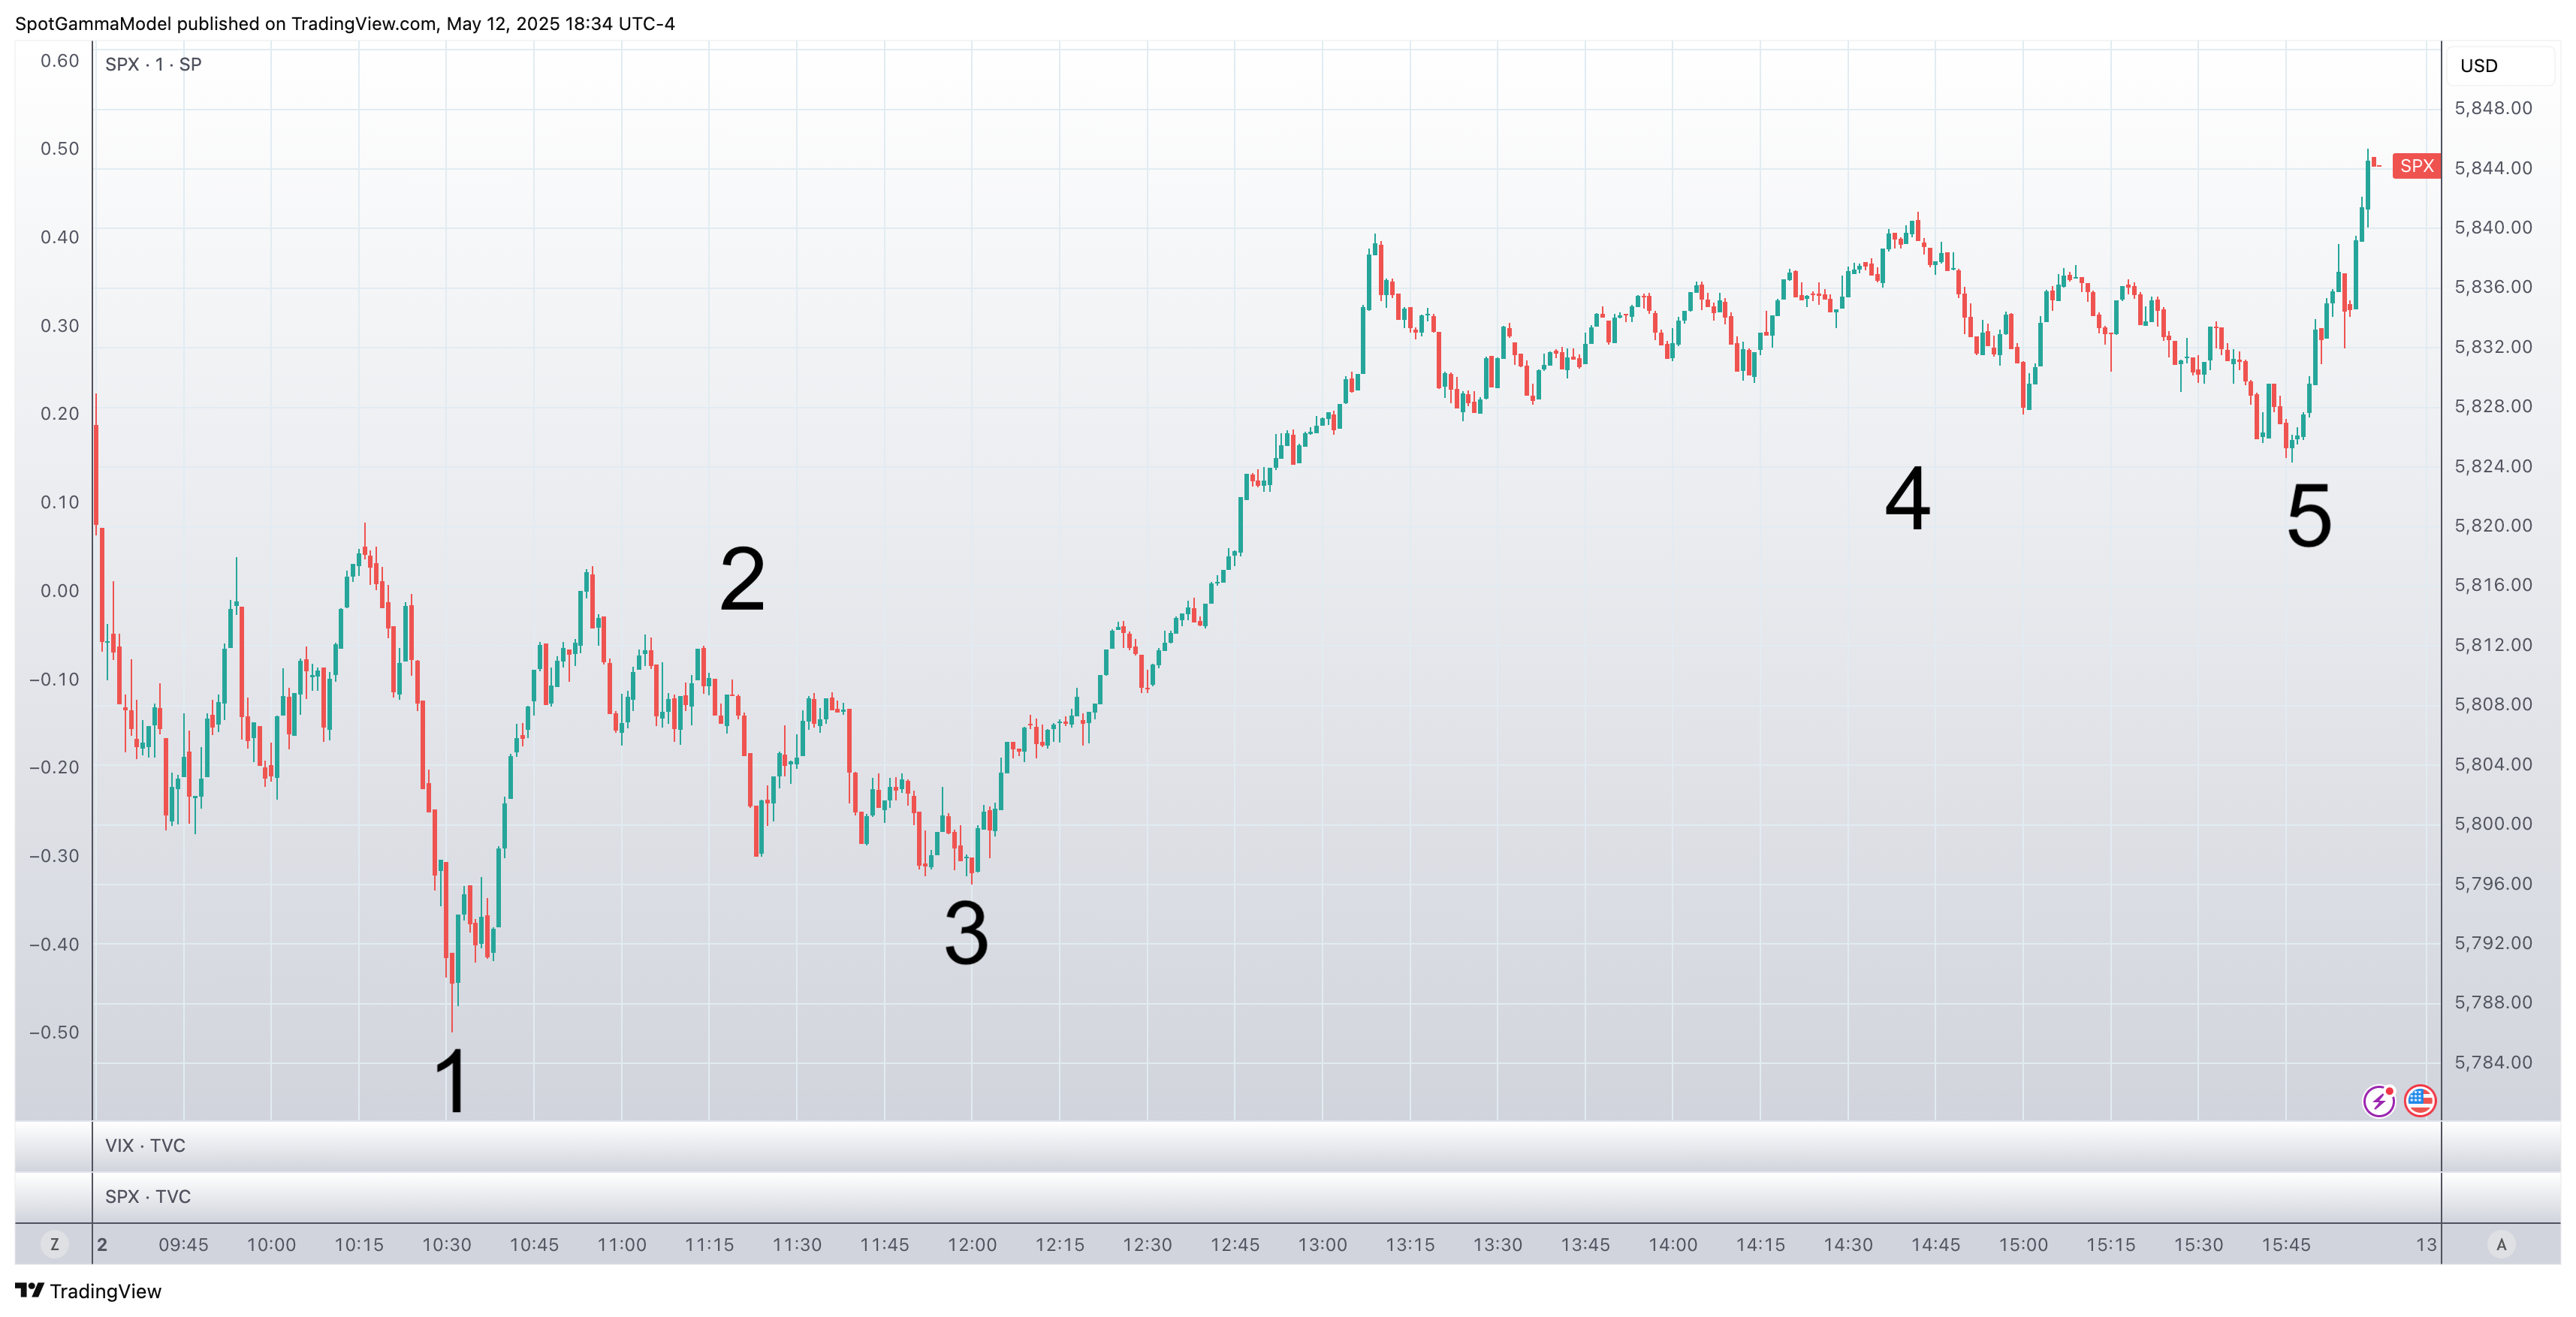
Below is the price action for the SPX on 5/12/25, labeled with numbers that correspond to SpotGamma’s charts, which follow.
As you can see, the SPX largely trended sideways from the open to 12PM ET (#0-3), and then hit intraday highs shortly after noon (4).
The session culminated with a sharp 20-handle rally over the last 15 minutes of the session to close at the days highs (5).

Below we break down how this price action was dominated by SPX 0DTE options, conducting the analysis using several SpotGamma tools, which allow us to break down the impact of options flow in real time.
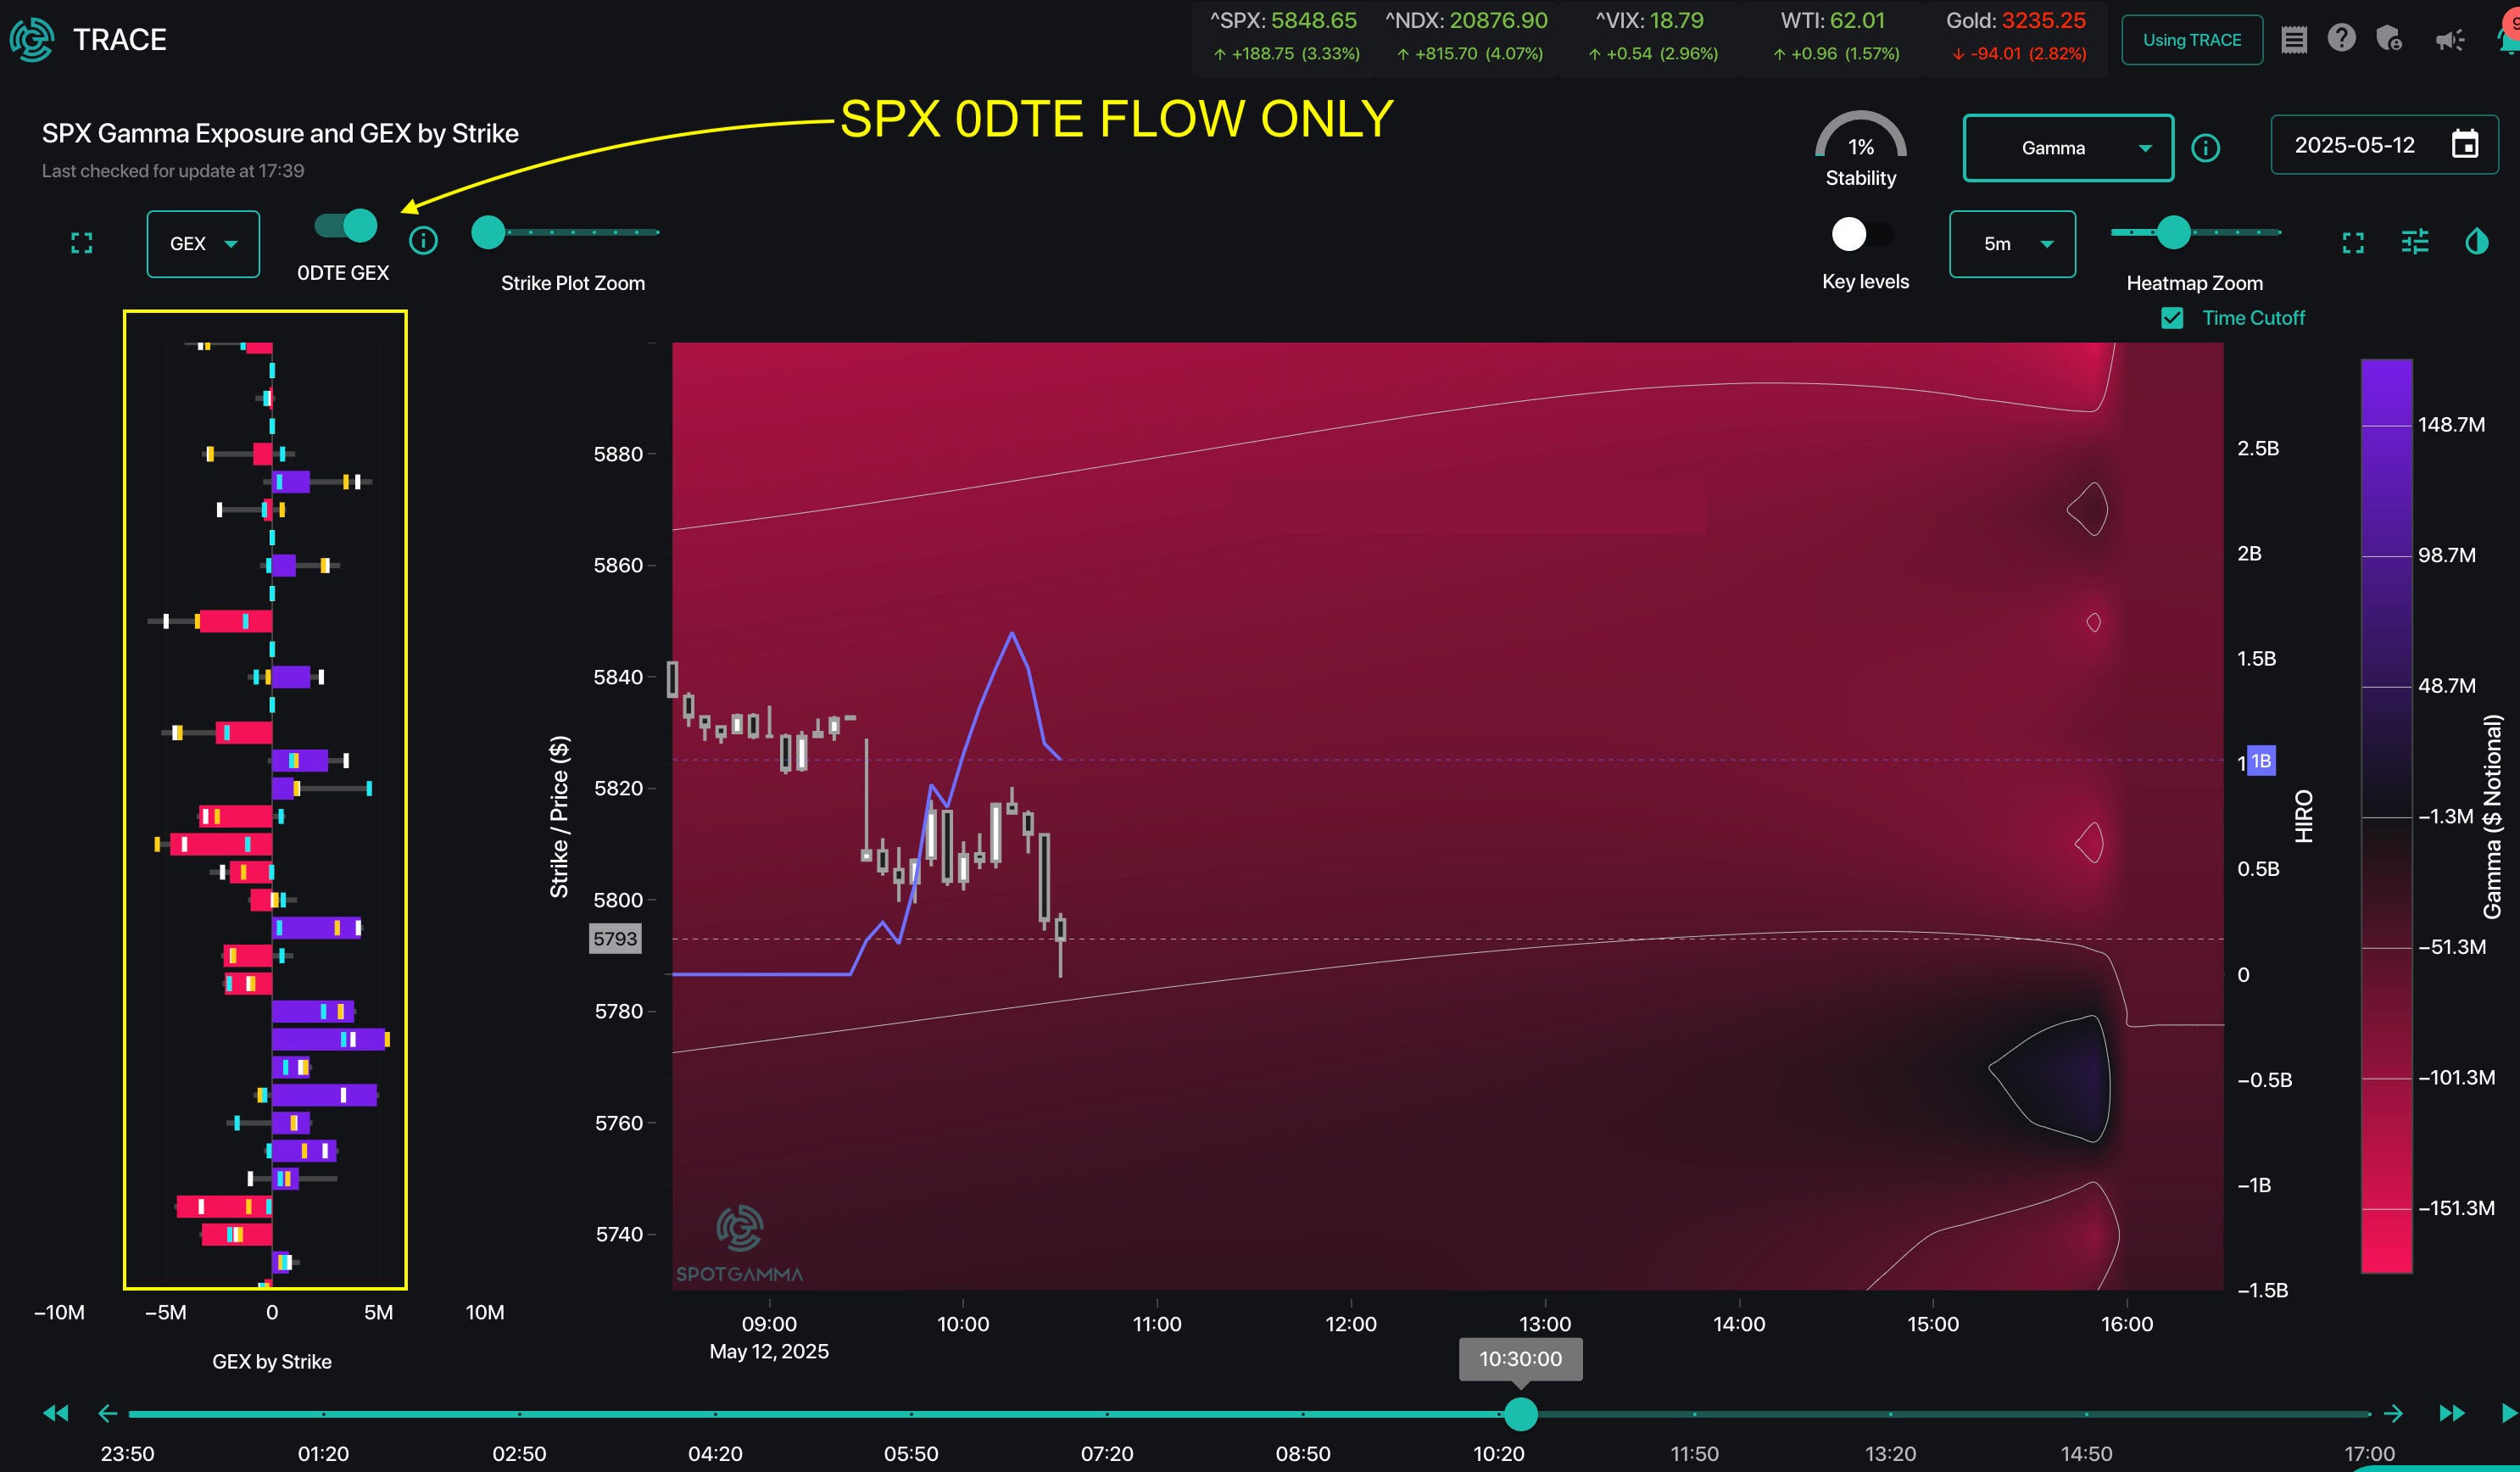
1: 10:30 AM ET
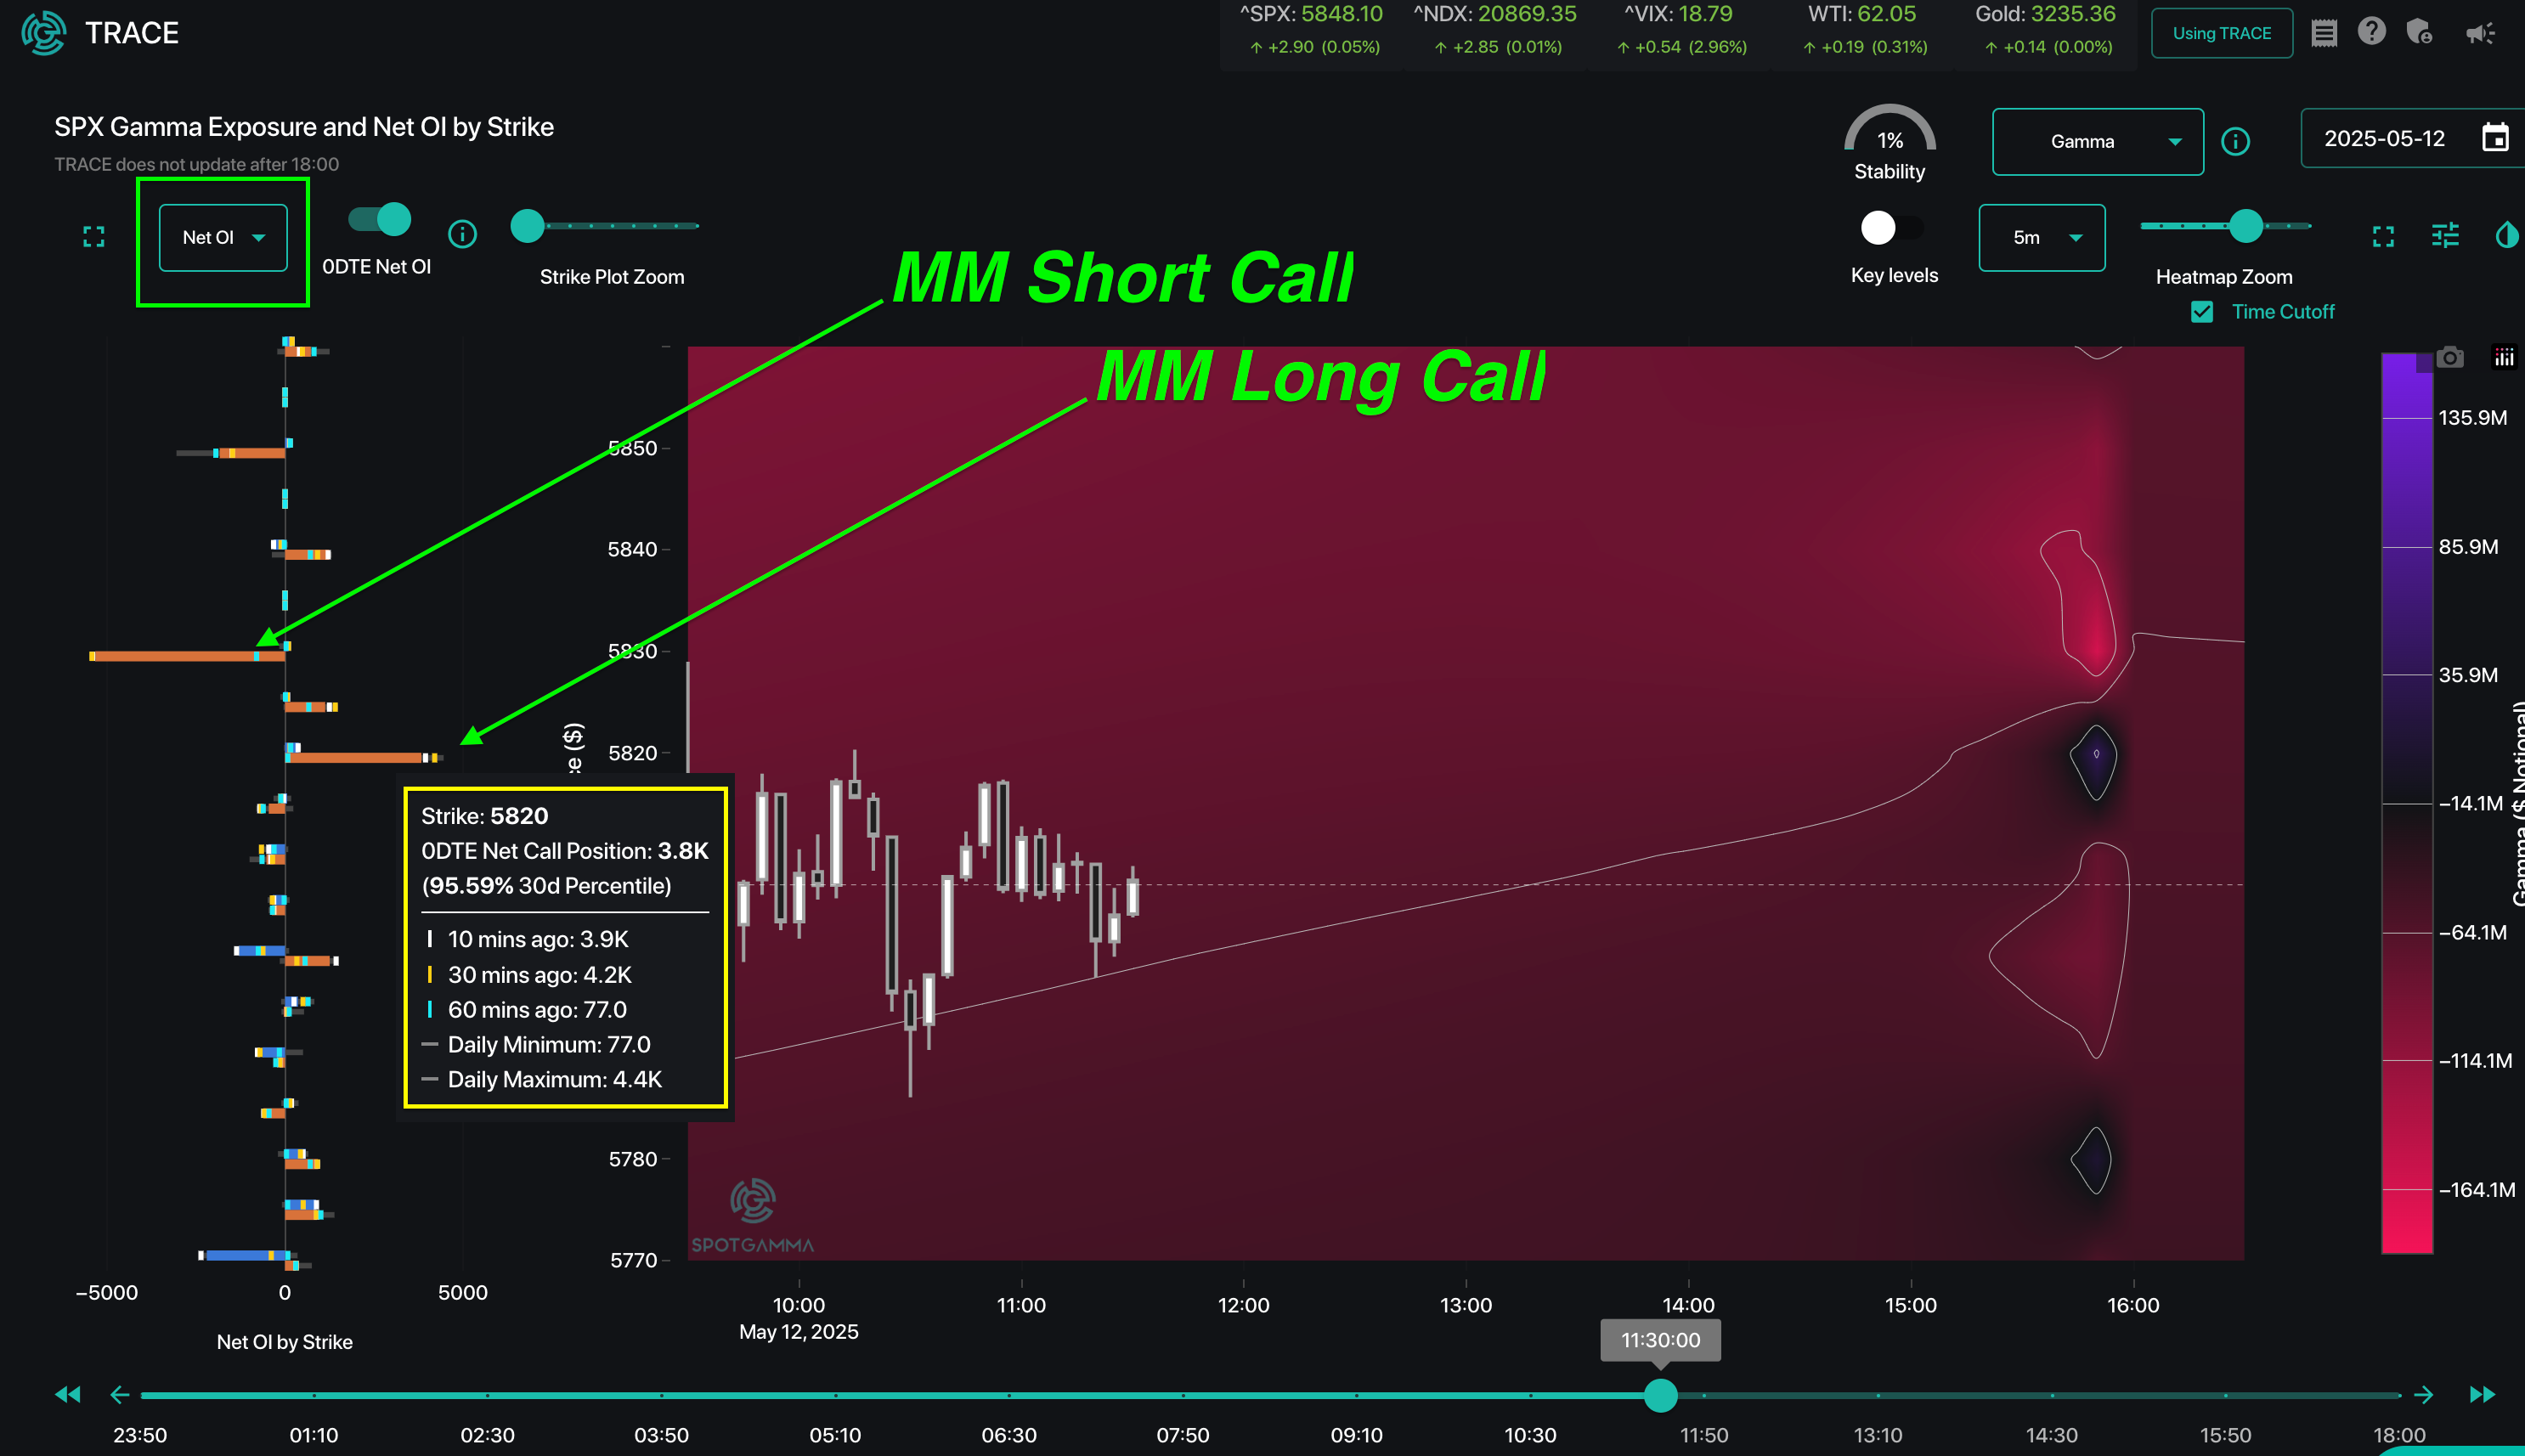
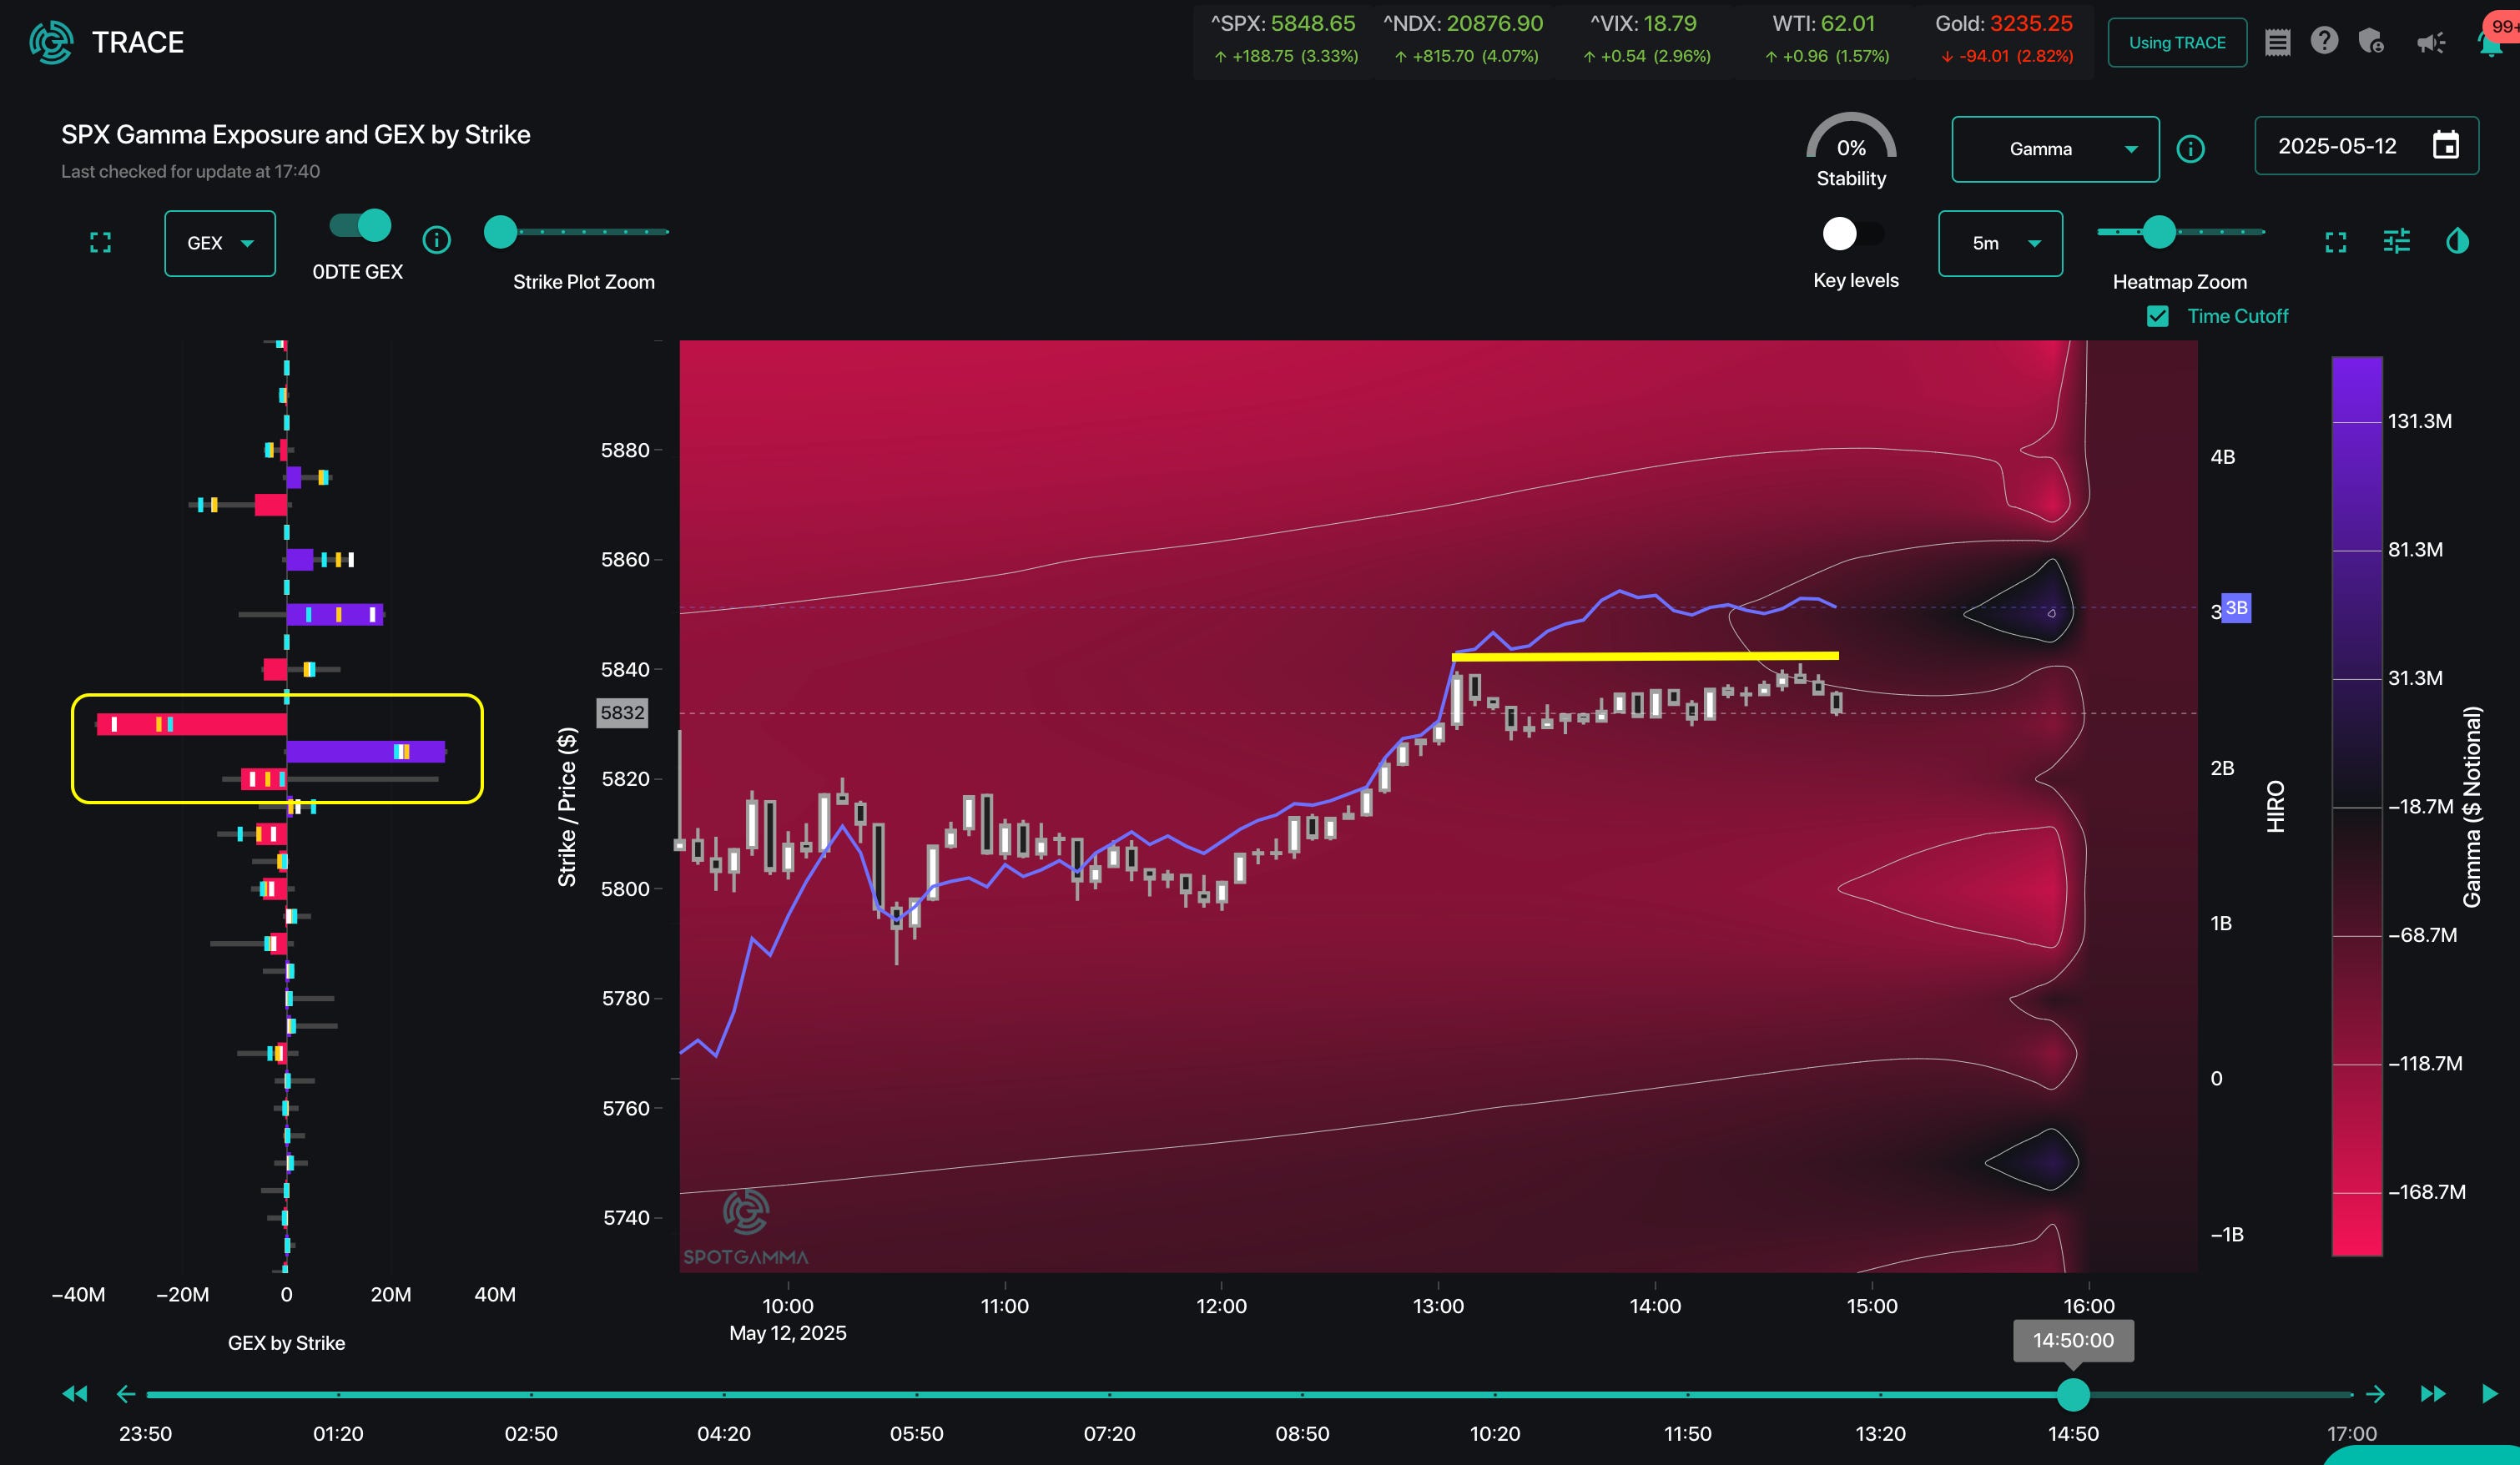
Below is our TRACE map, which depicts SPX option market maker (MM) exposure in real time. Areas of the map that are red infer a relative MM negative gamma position, while purple indicates a positive gamma position.
In this post, we are going to focus on the gamma-by-strike data (yellow box), with MM positive gamma strikes reflected in purple, and negative gamma strikes in red.
As you can see via the small bars on the plot, there are no stand-out strikes at 10:30 AM ET (x axis), with all SPX strikes being <$5mm in gamma (as we will see shortly, gamma-by strike for 0DTE options can often be >$20mm).
This overall start of day position infers 0DTE SPX positions were rather light before 10:30 AM, which makes sense after the massive 3% overnight rally, and early digestion of the US/China tariff negotiations.
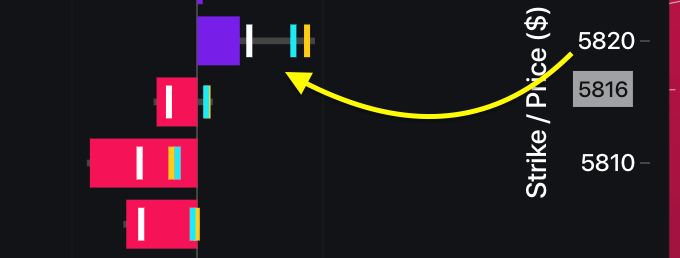
Before we move on, we should note that the current gamma for a given strike is shown to be the highest level on the day if there is no candle “wick”. A “wick” indicates a position was closed.
For example, the 5,820 strike below was clearly closed, as it is only ~1/3 of its max size on the day (i.e. the full length of the wick). The 5,810, however, is at the max size of the day.
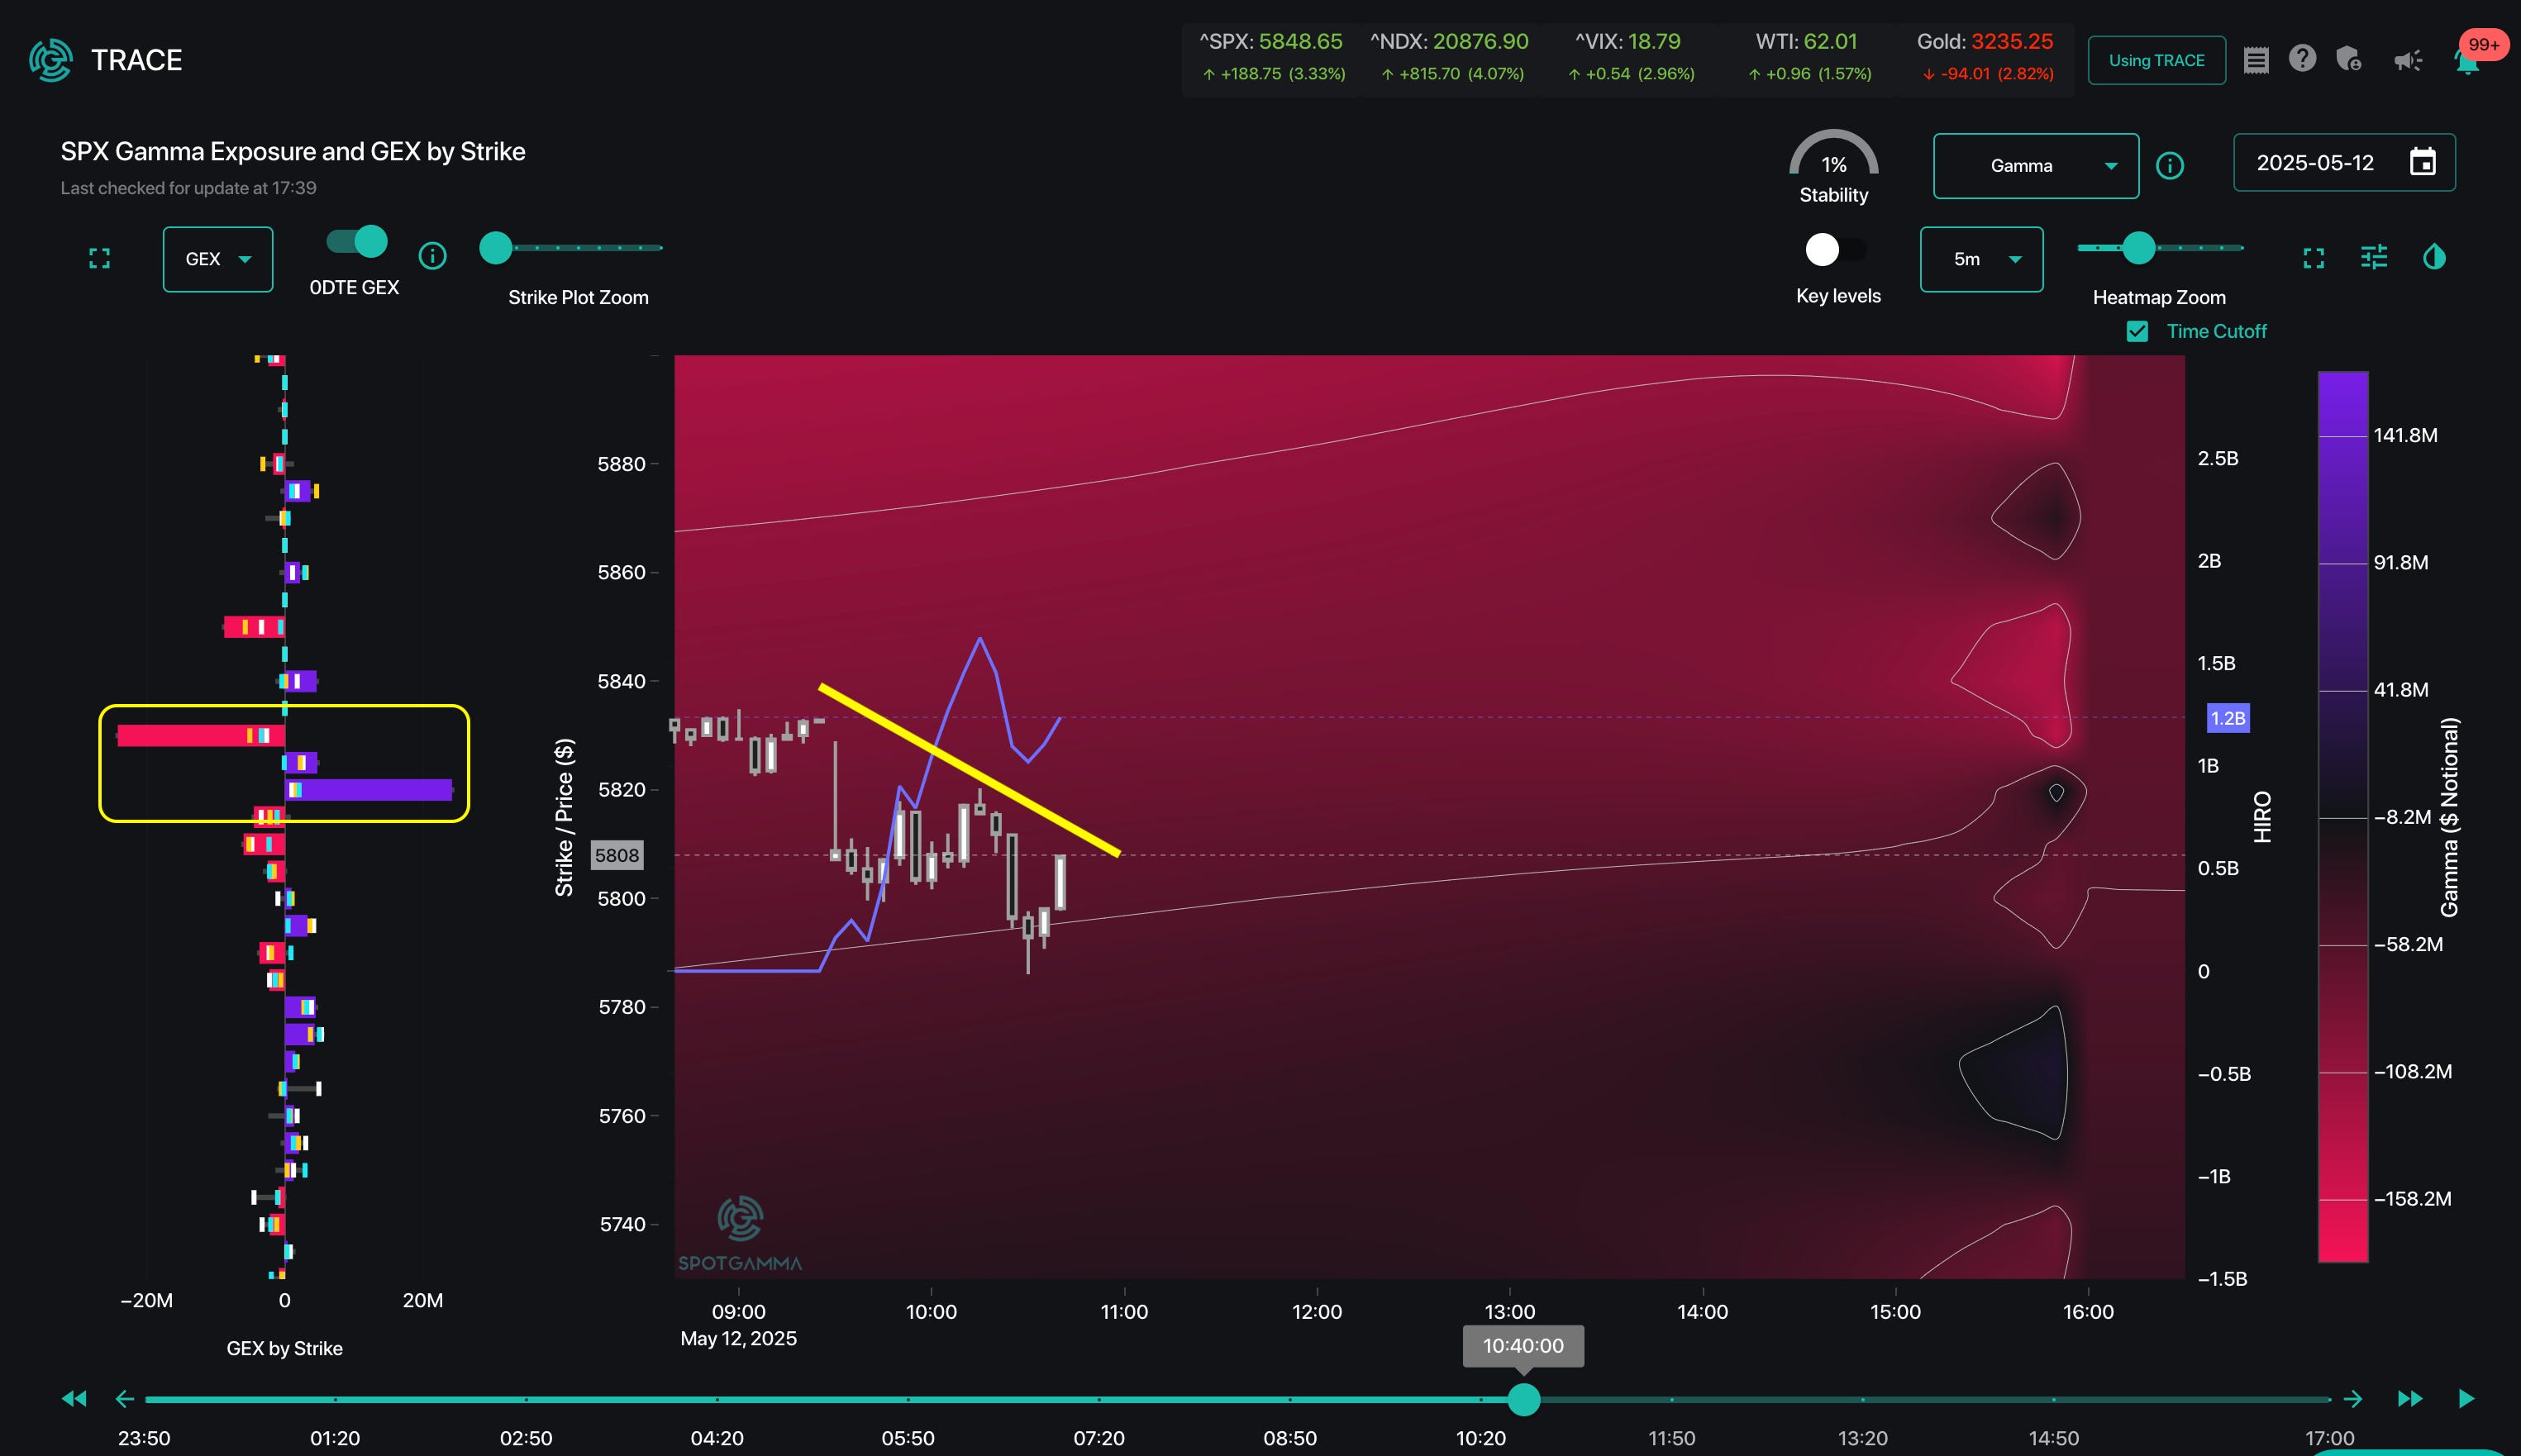
2: 10:40AM ET
The SPX 0DTE positioning changes just after 10:30 AM, ET. As you can see, a large position was initiated, resulting in big gamma bars at 5,820 & 5,830 (yellow box). We also note the SPX price action stabilized in this 5,820 area – and remained near that price until 12 PM.
This new position was north of $20mm gamma by strike, which we calculate as +98th percentile in size.
$20mm per strike is a lot of gamma, and that appeared to pin the SPX.
Just what was this 0DTE flow which shows in TRACE as as a trader selling a 10 handle wide SPX 0DTE short call spread?
We can state that it is a short spread because TRACE (above) reflects the MM is LONG gamma at the 5,820 call (purple bar), and SHORT gamma at the 5,830 (red strike).
For more clarity, TRACE allows us to explicitly break out the positions by call/put, which confirms the MM is indeed long the 5,820 x 5,830 call spread. The MM bought this spread from a trader.
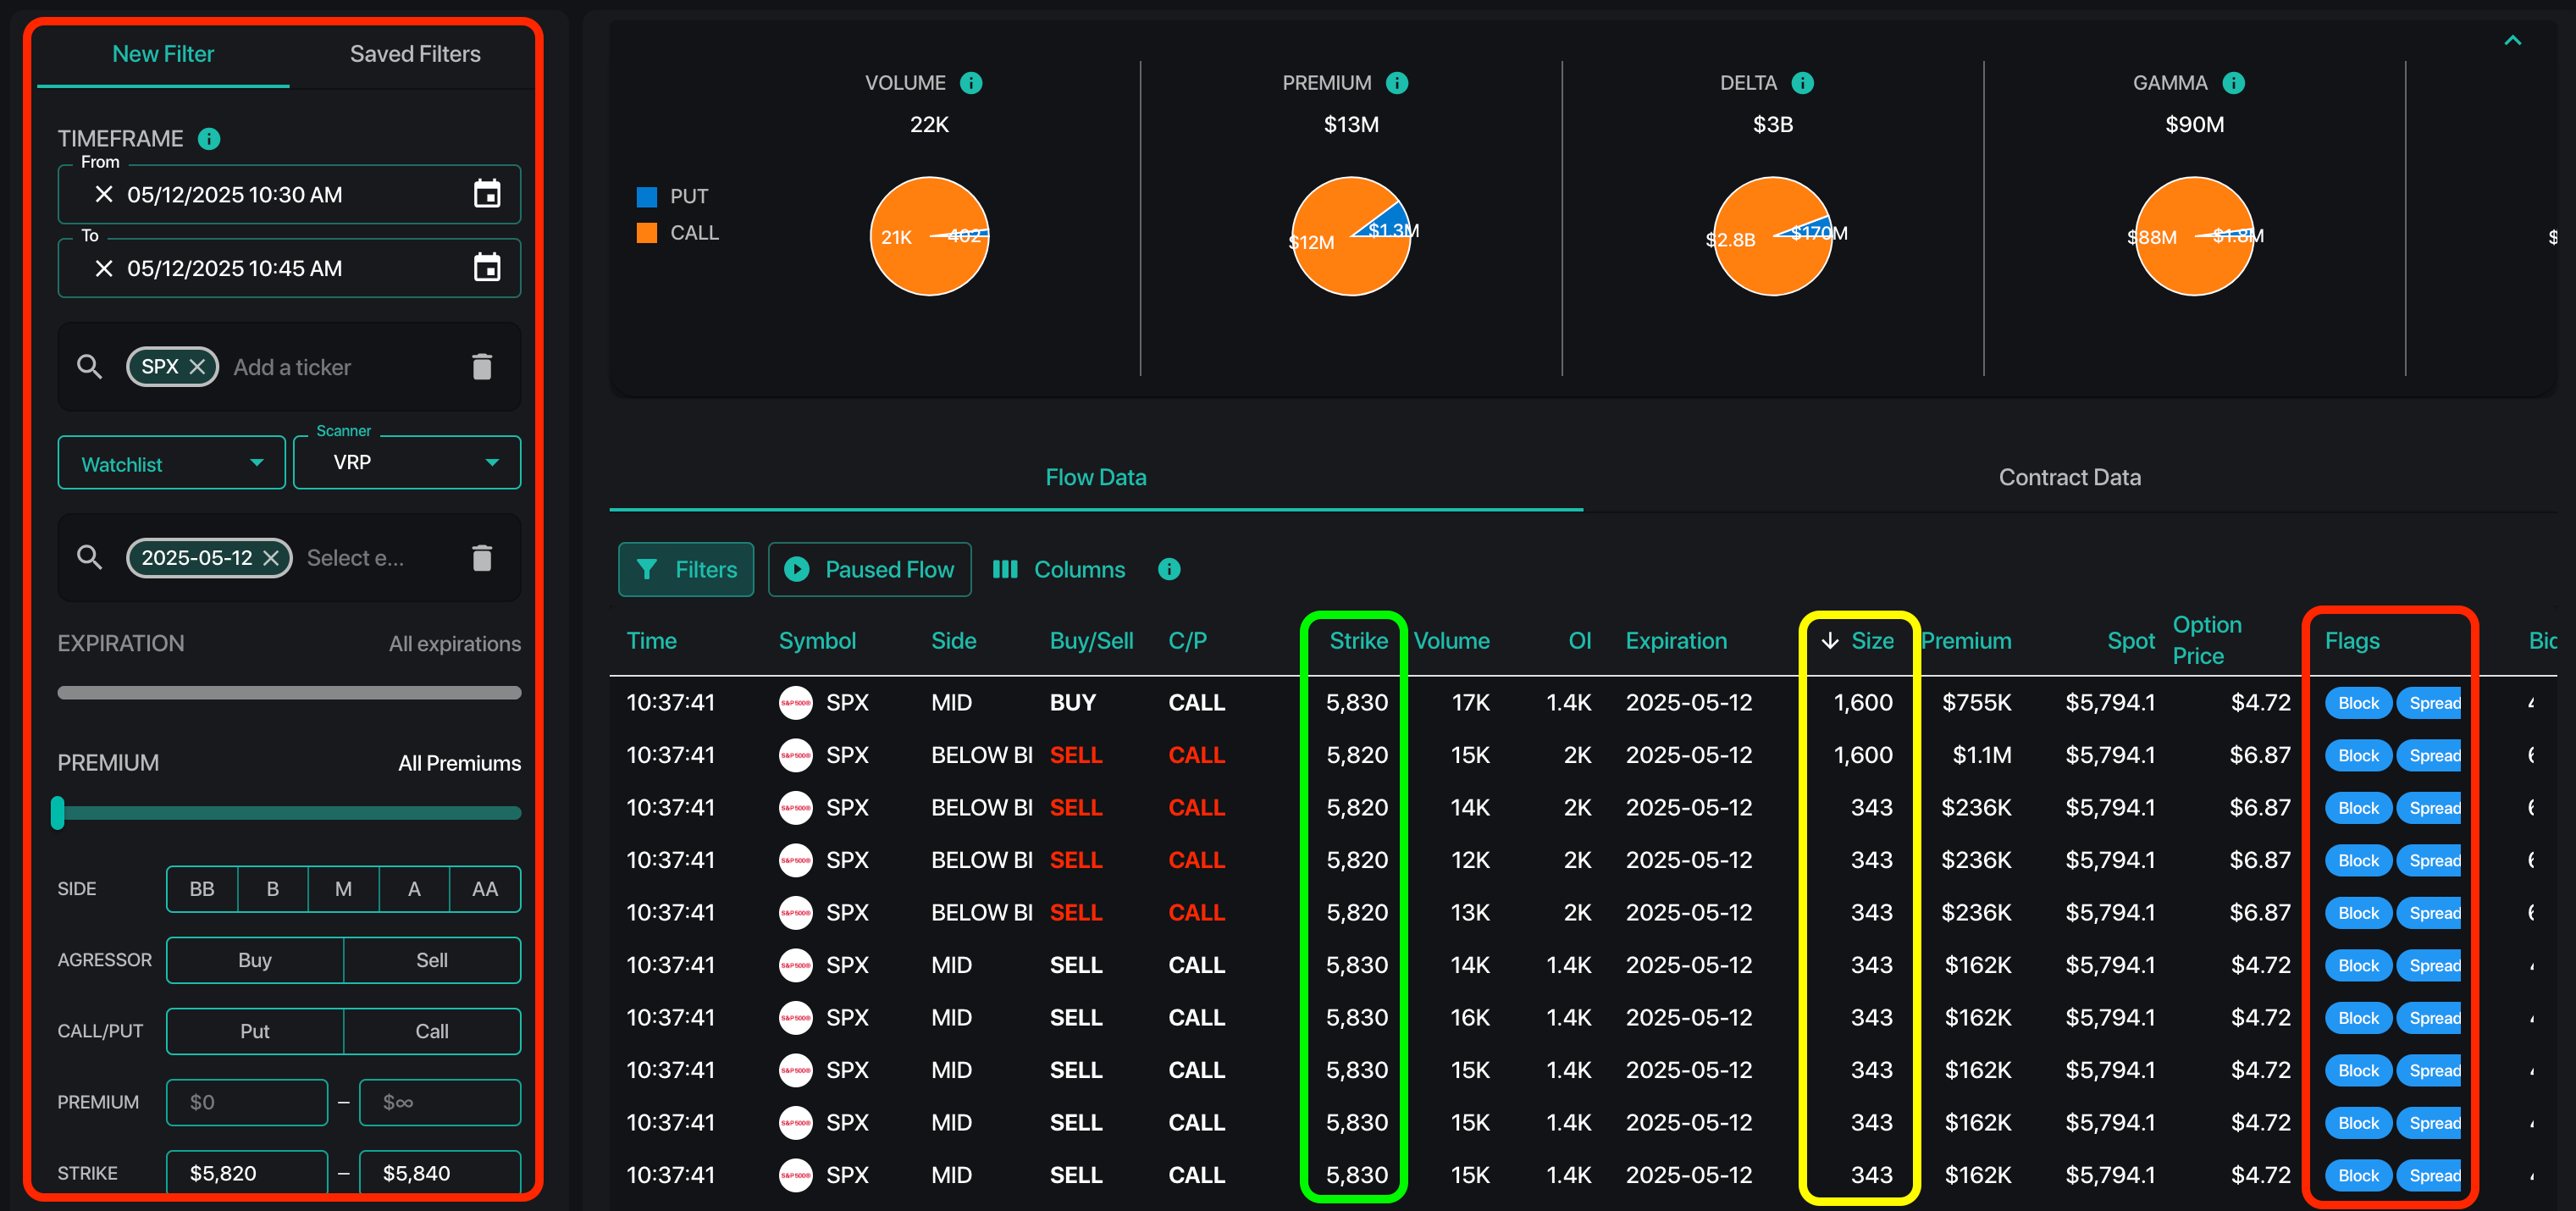
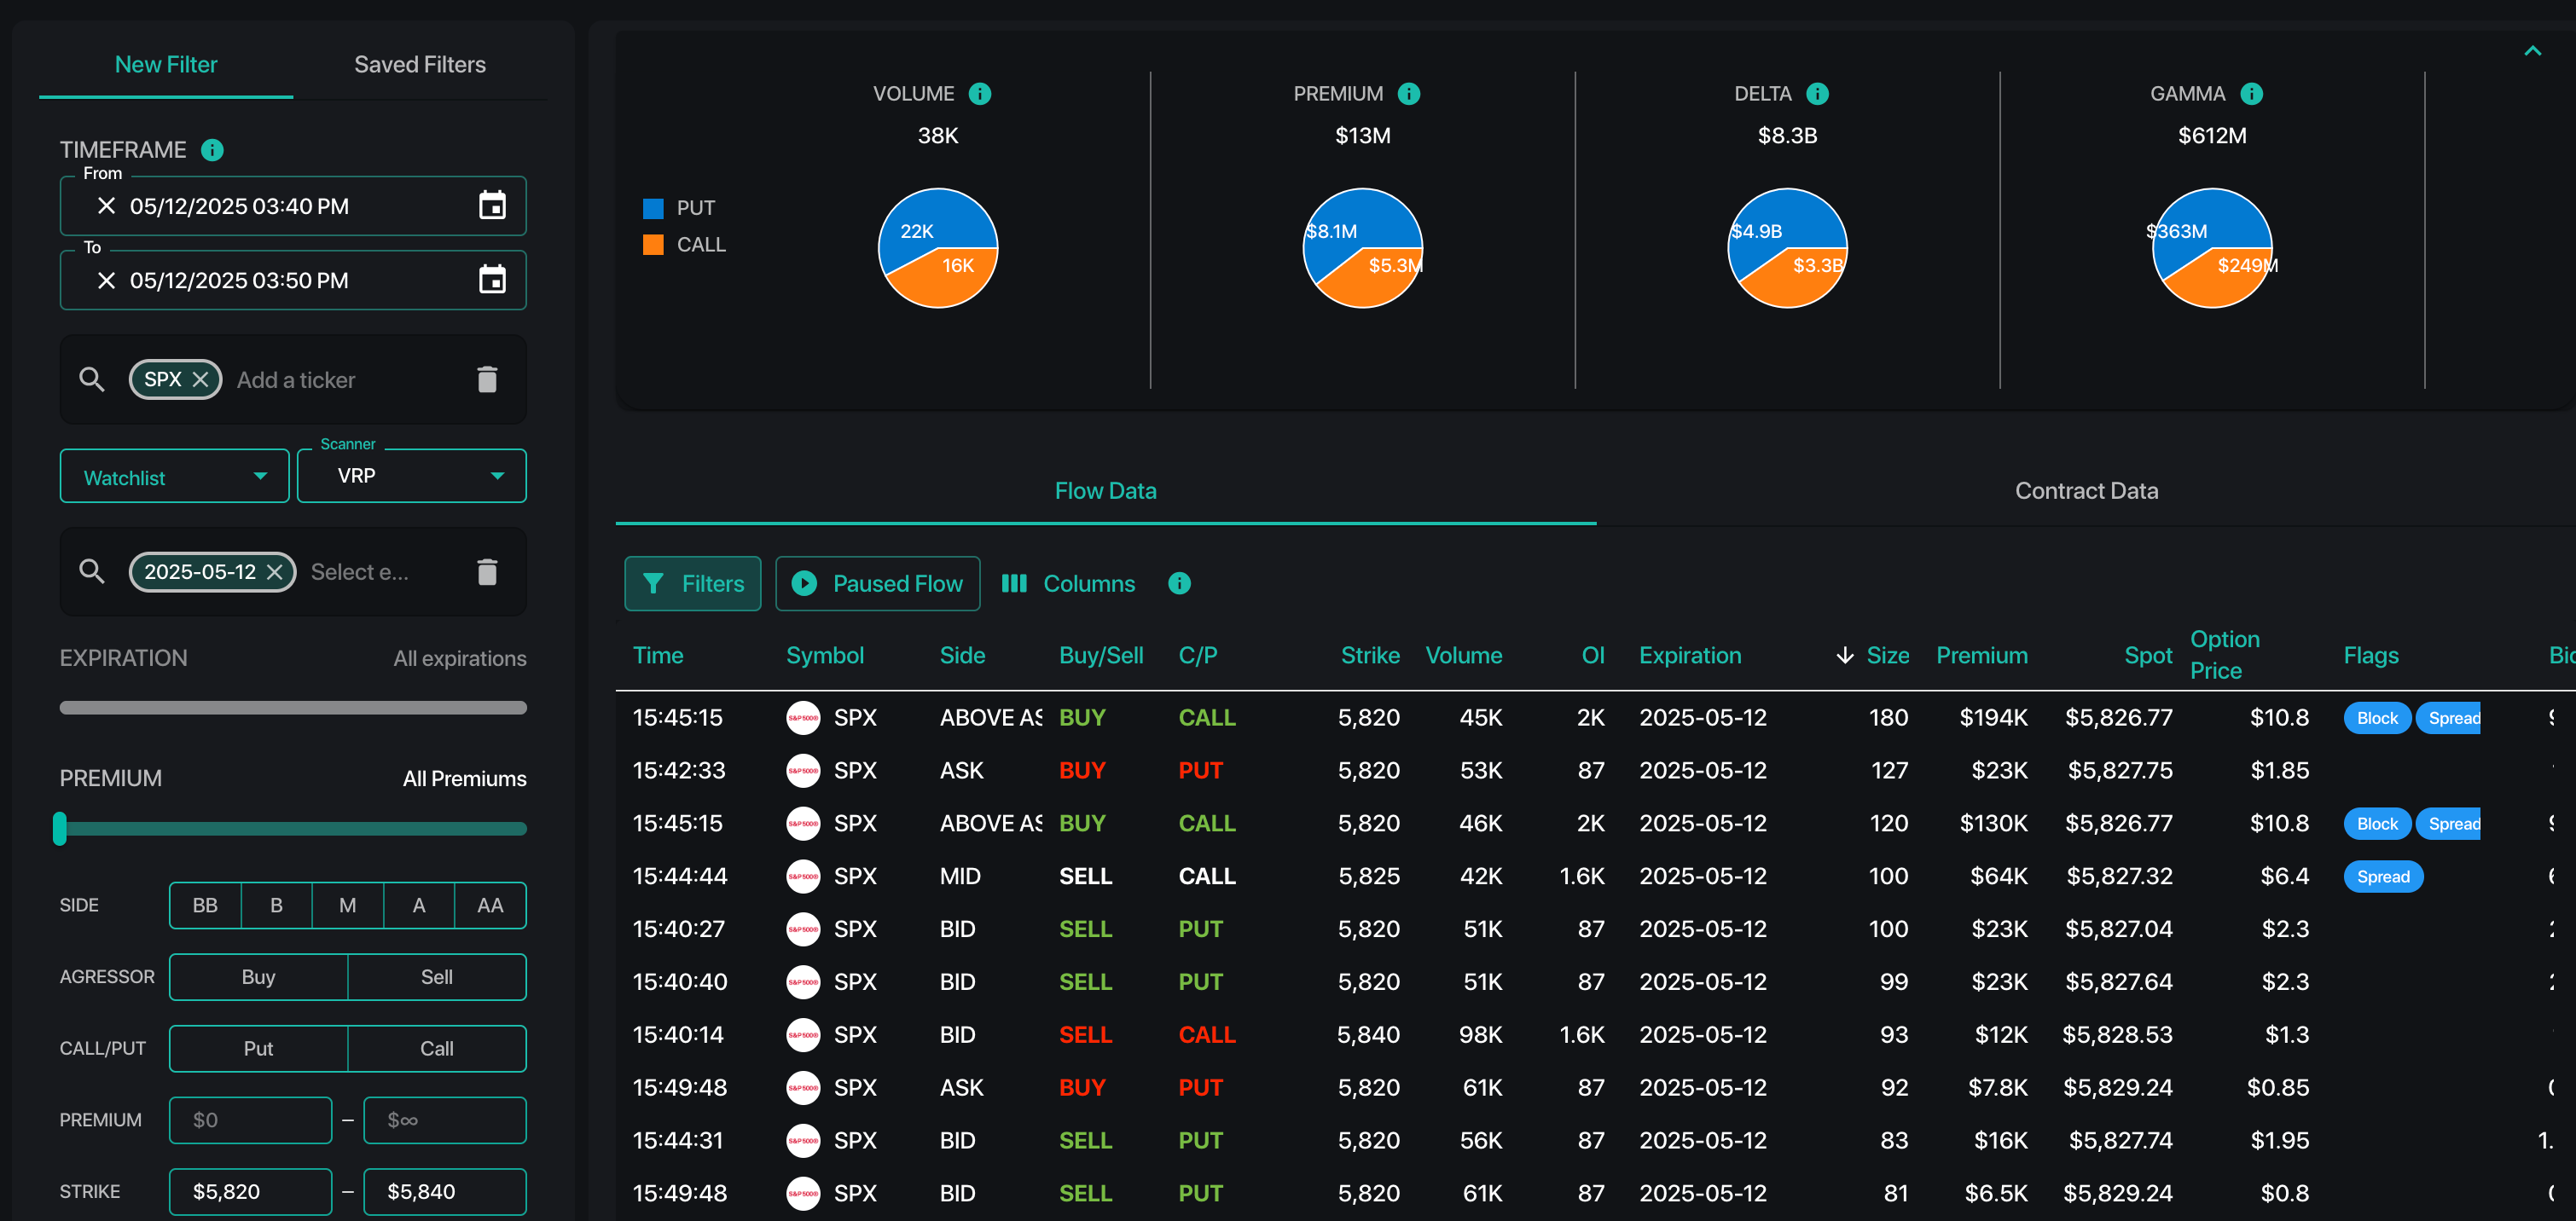
We can then zoom into further on this flow using our TAPE tool, which aggregates and searches through options time & sales data.
First, we filtered for the contracts just highlighted (left red box):
- 10:30 – 10:45 AM ET
- SPX 0DTE expiration (5/12/25)
- Strike range: 5,820 – 5,840 (the large gamma seen in TRACE, above)
The data reveals a series of trades at the 5,820-5,840 strikes (green & yellow boxes), and we also note these have a spread trade flag (right red box), which informs us that these trades were indeed a package.
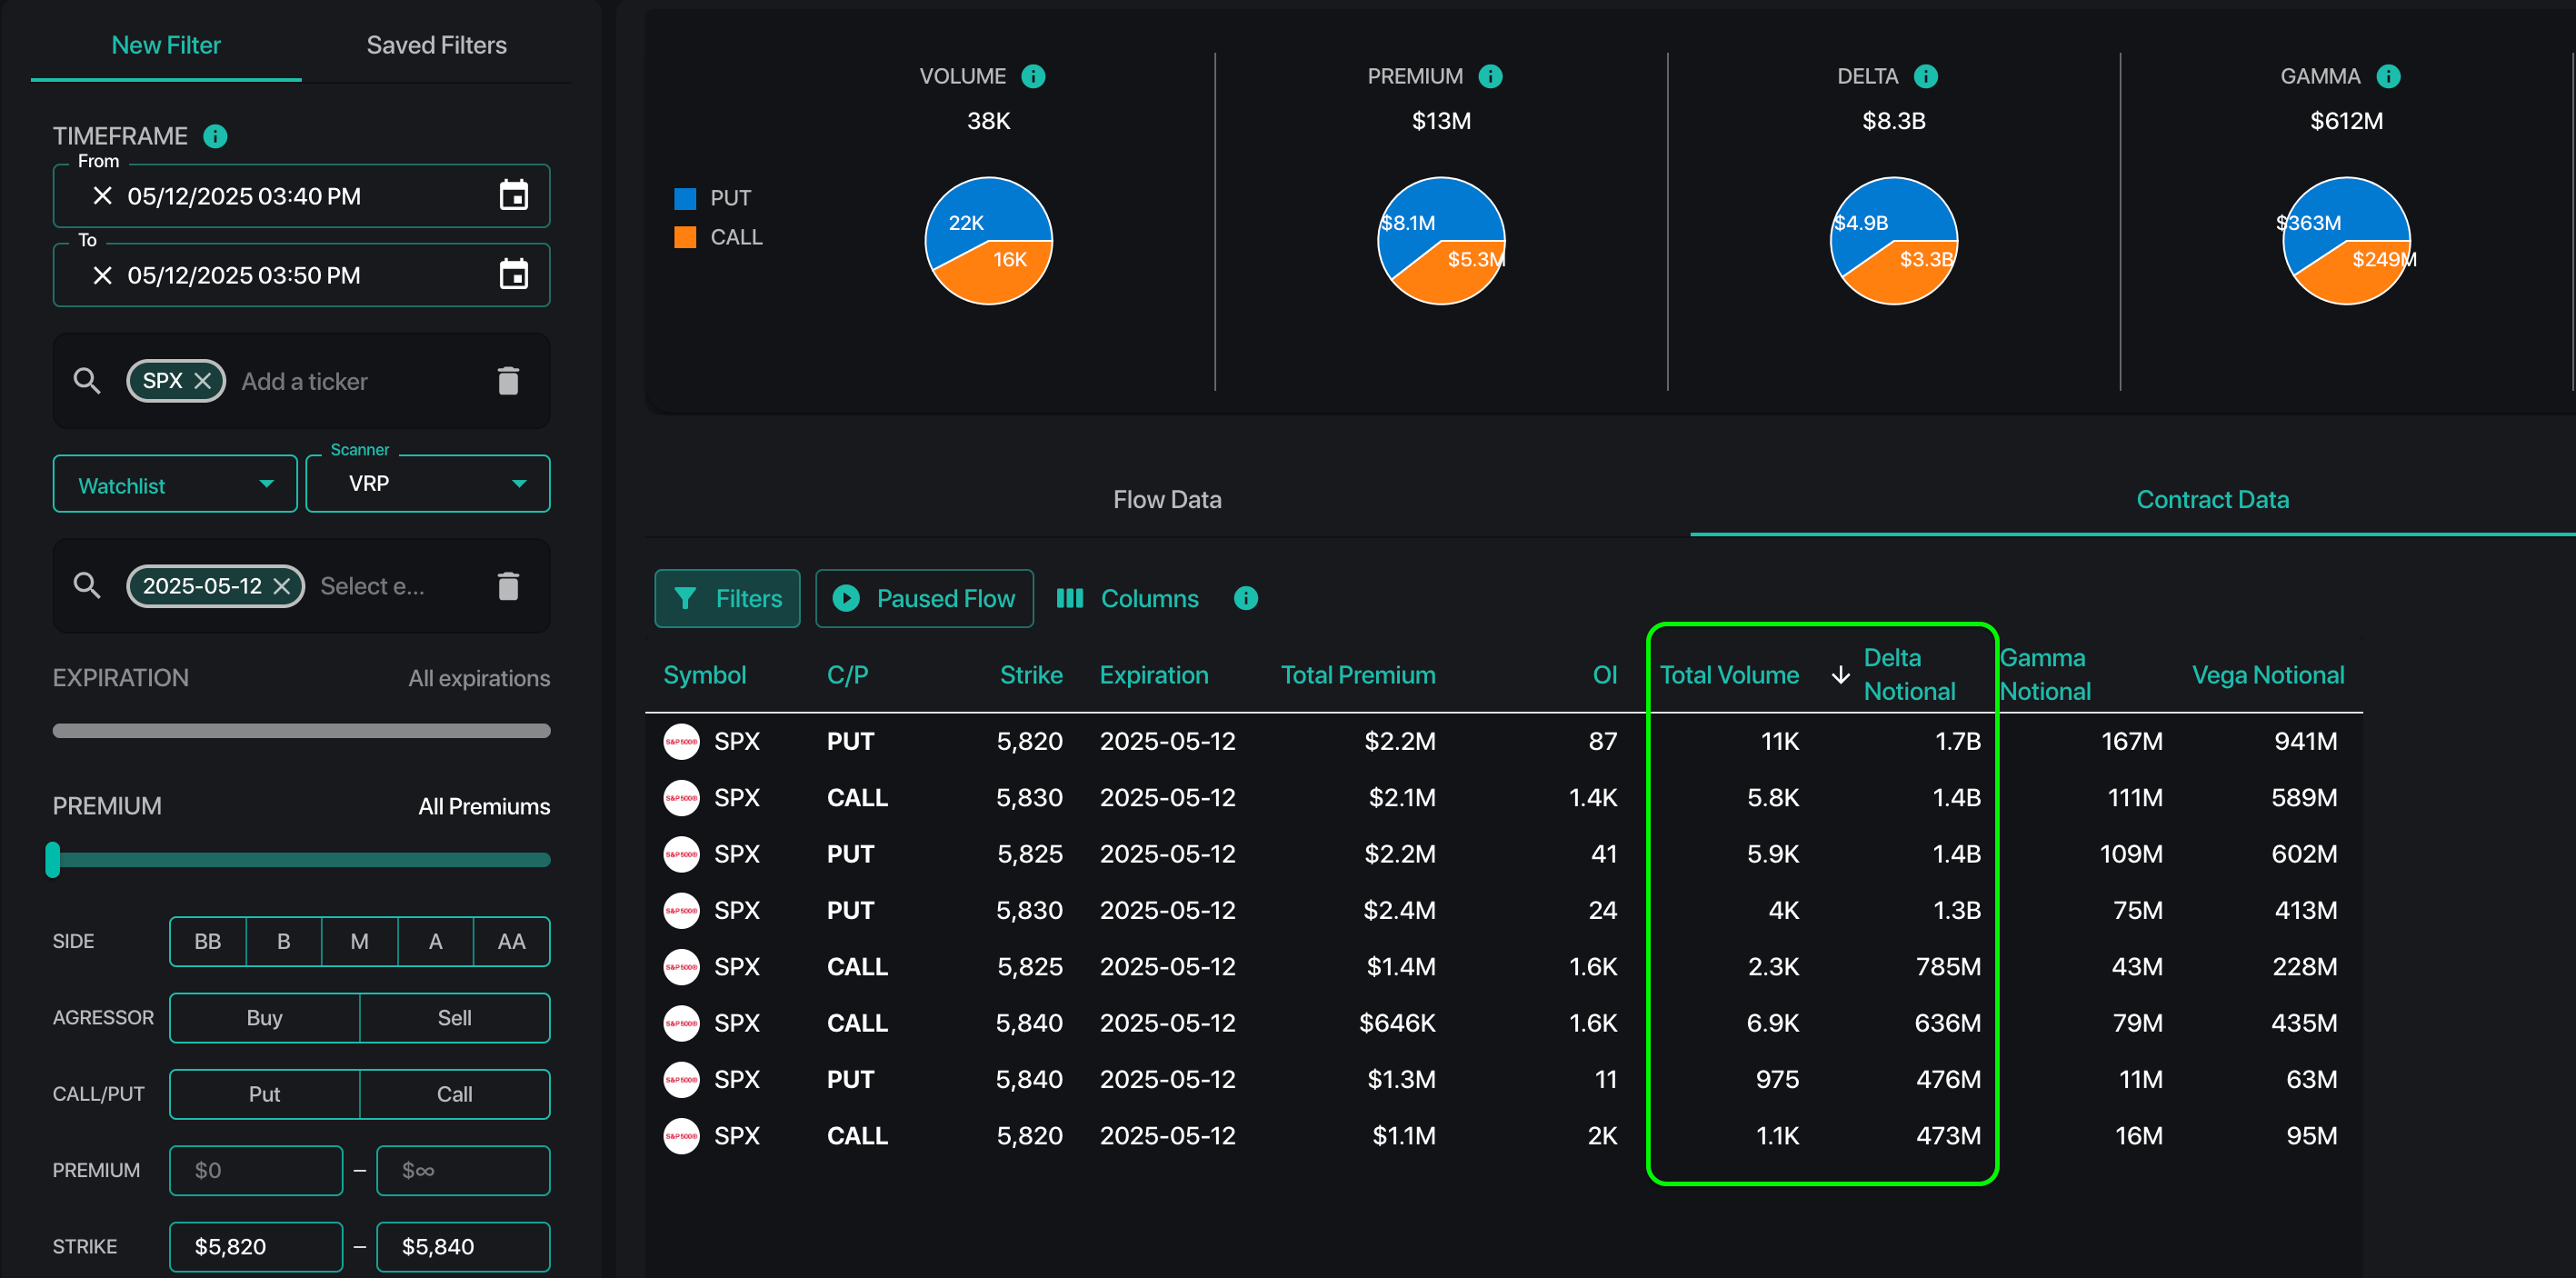
By clicking the “Contracts Data” tab, we get a summary of this flow over the filtered time period. As you can see, there were 4-7k contracts each of the 5,820 & 5,830 strike 0DTE calls traded between 10:30-10:45 AM ET.
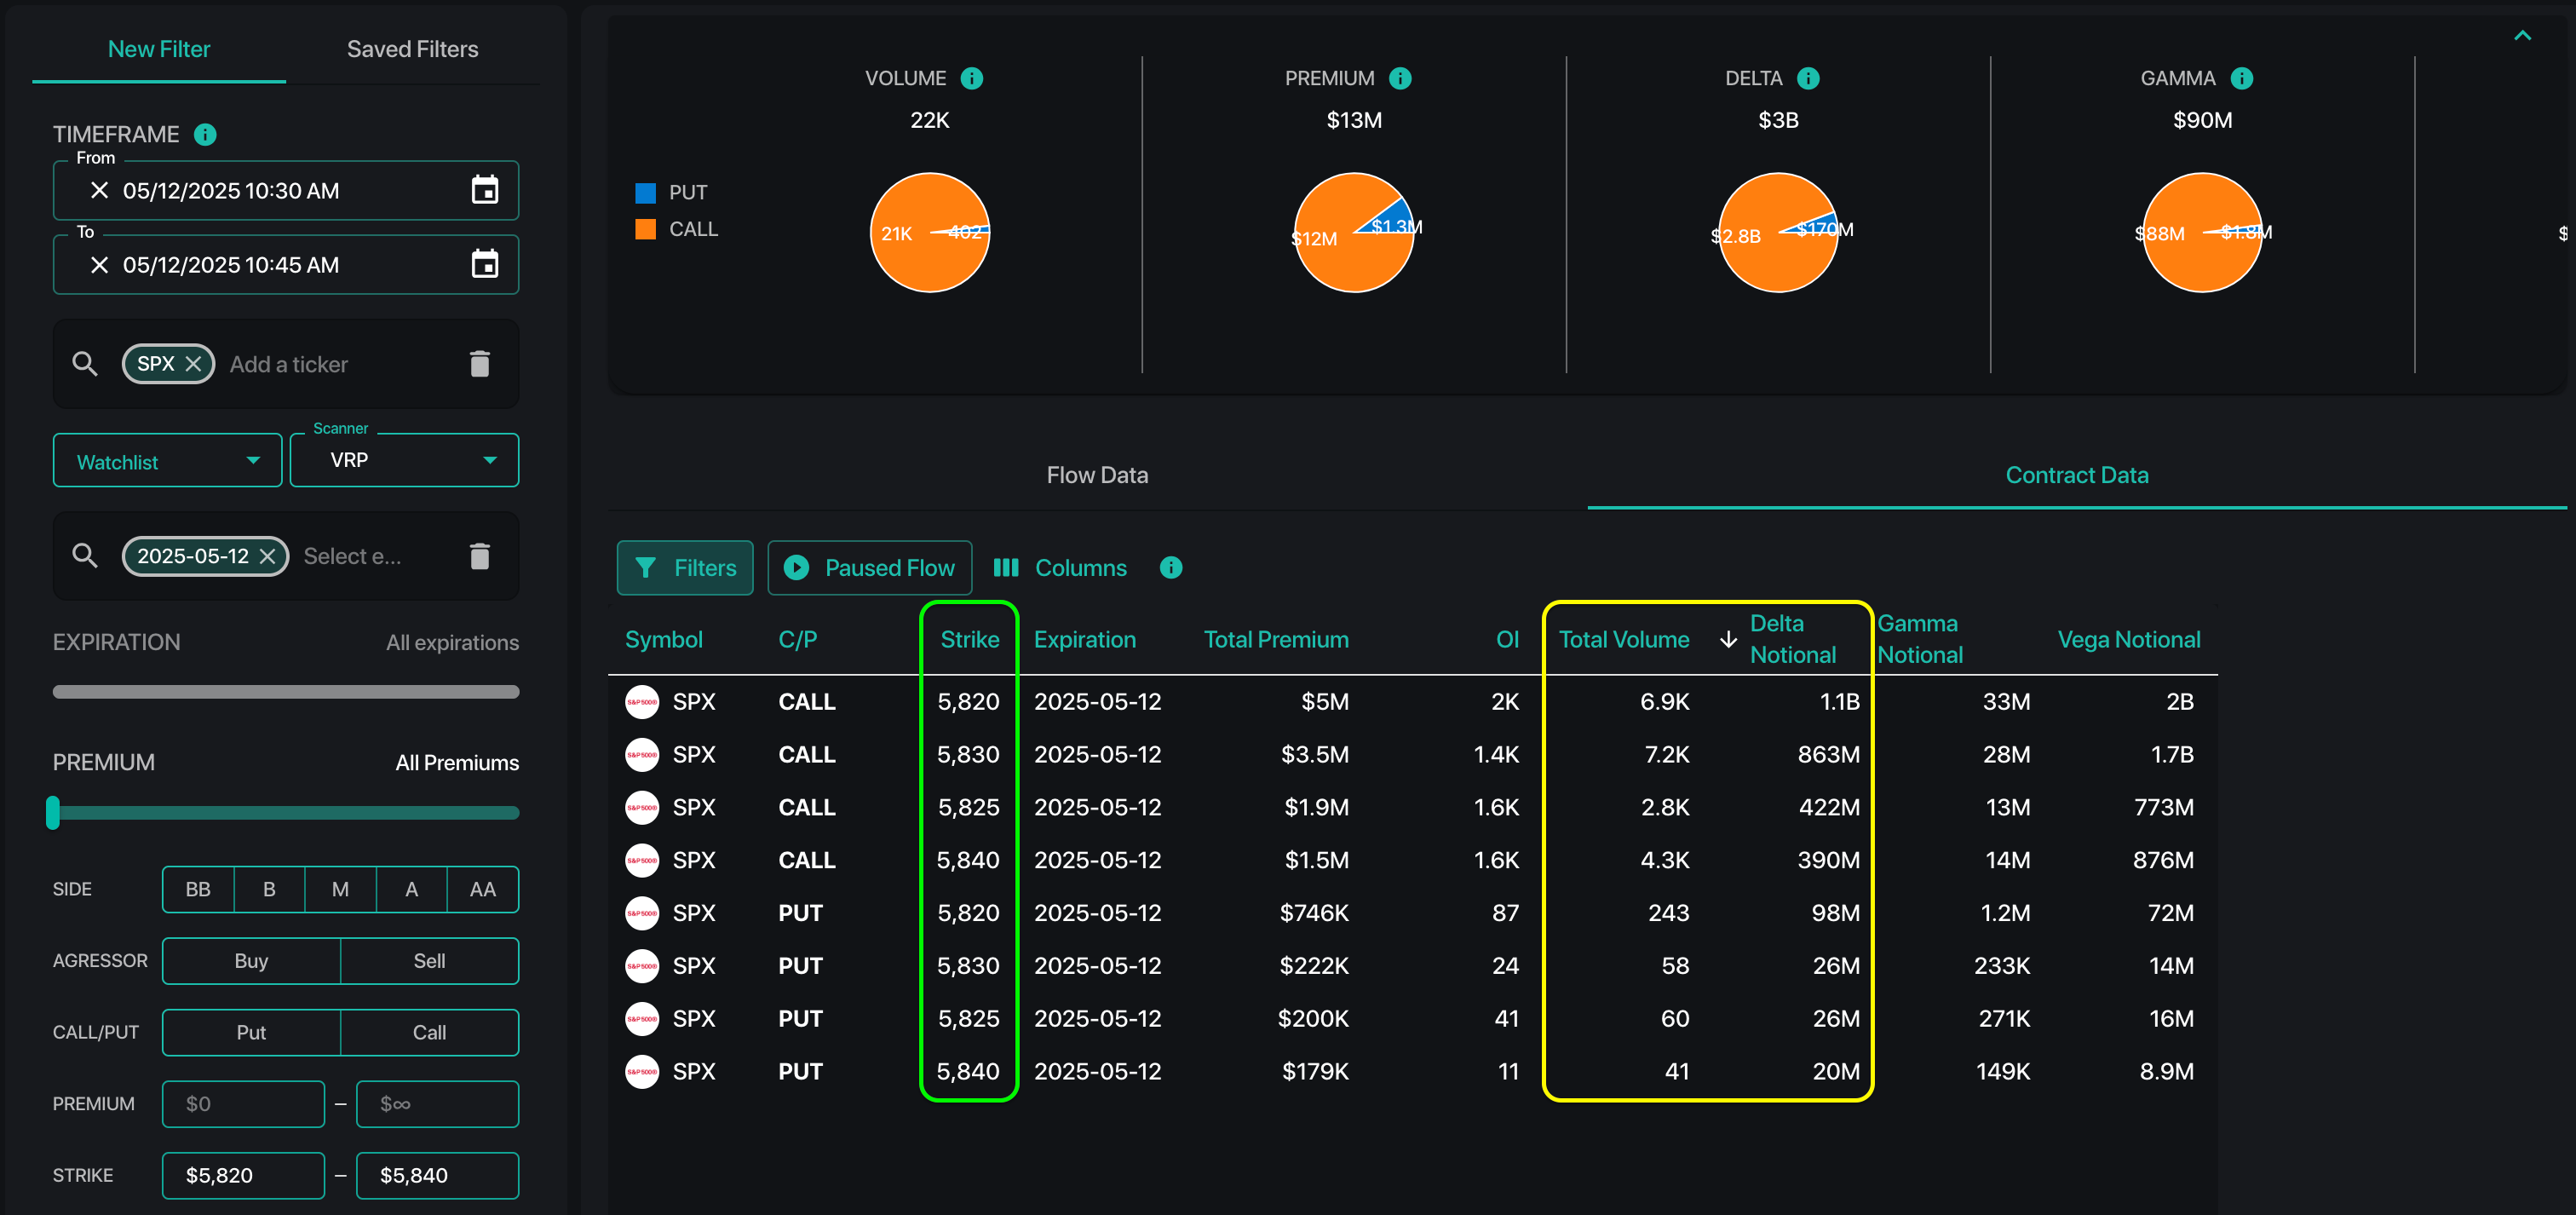
This is the resistance.
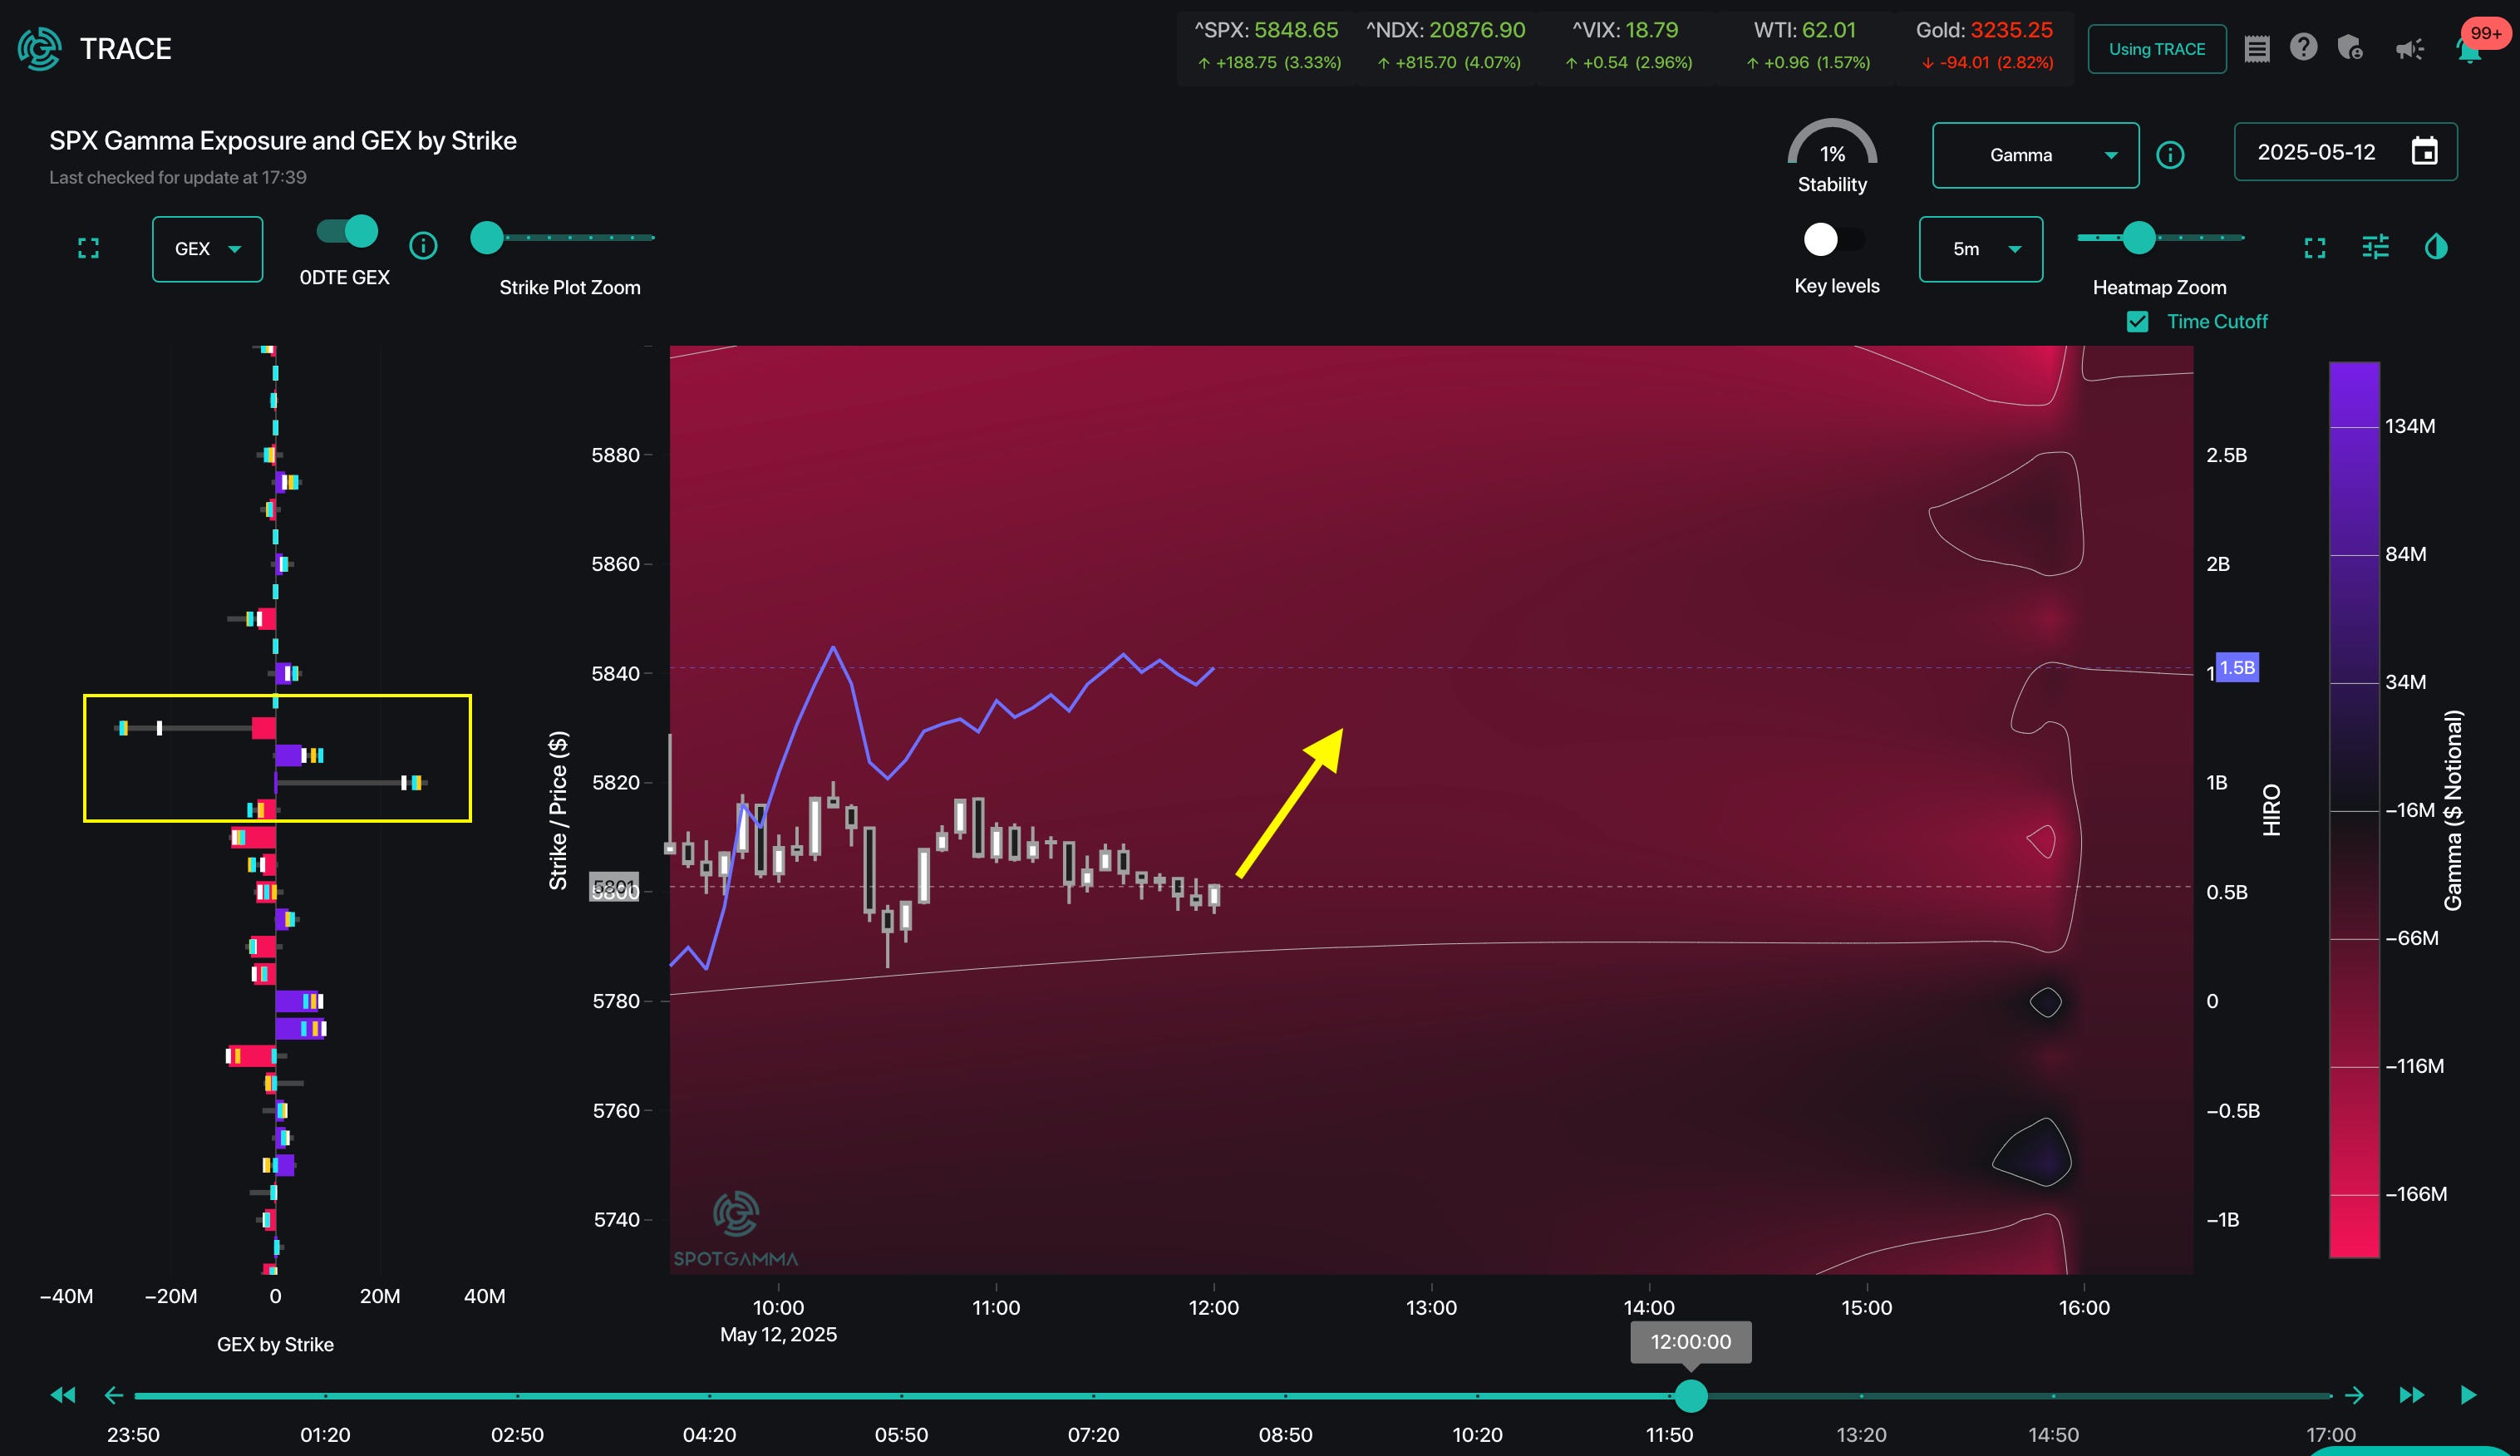
3: 12PM ET
Suddenly, just near 12PM ET the aforementioned strikes disappear from our TRACE map, indicating that the positions were closed. This sparks a significant rally in the SPX, to intraday highs near 5,845.
VIA the TAPE “Flow Data” Tab (1), which shows individual prints, we see the exact timestamp of these closing trades, which was 11:51 AM EST.
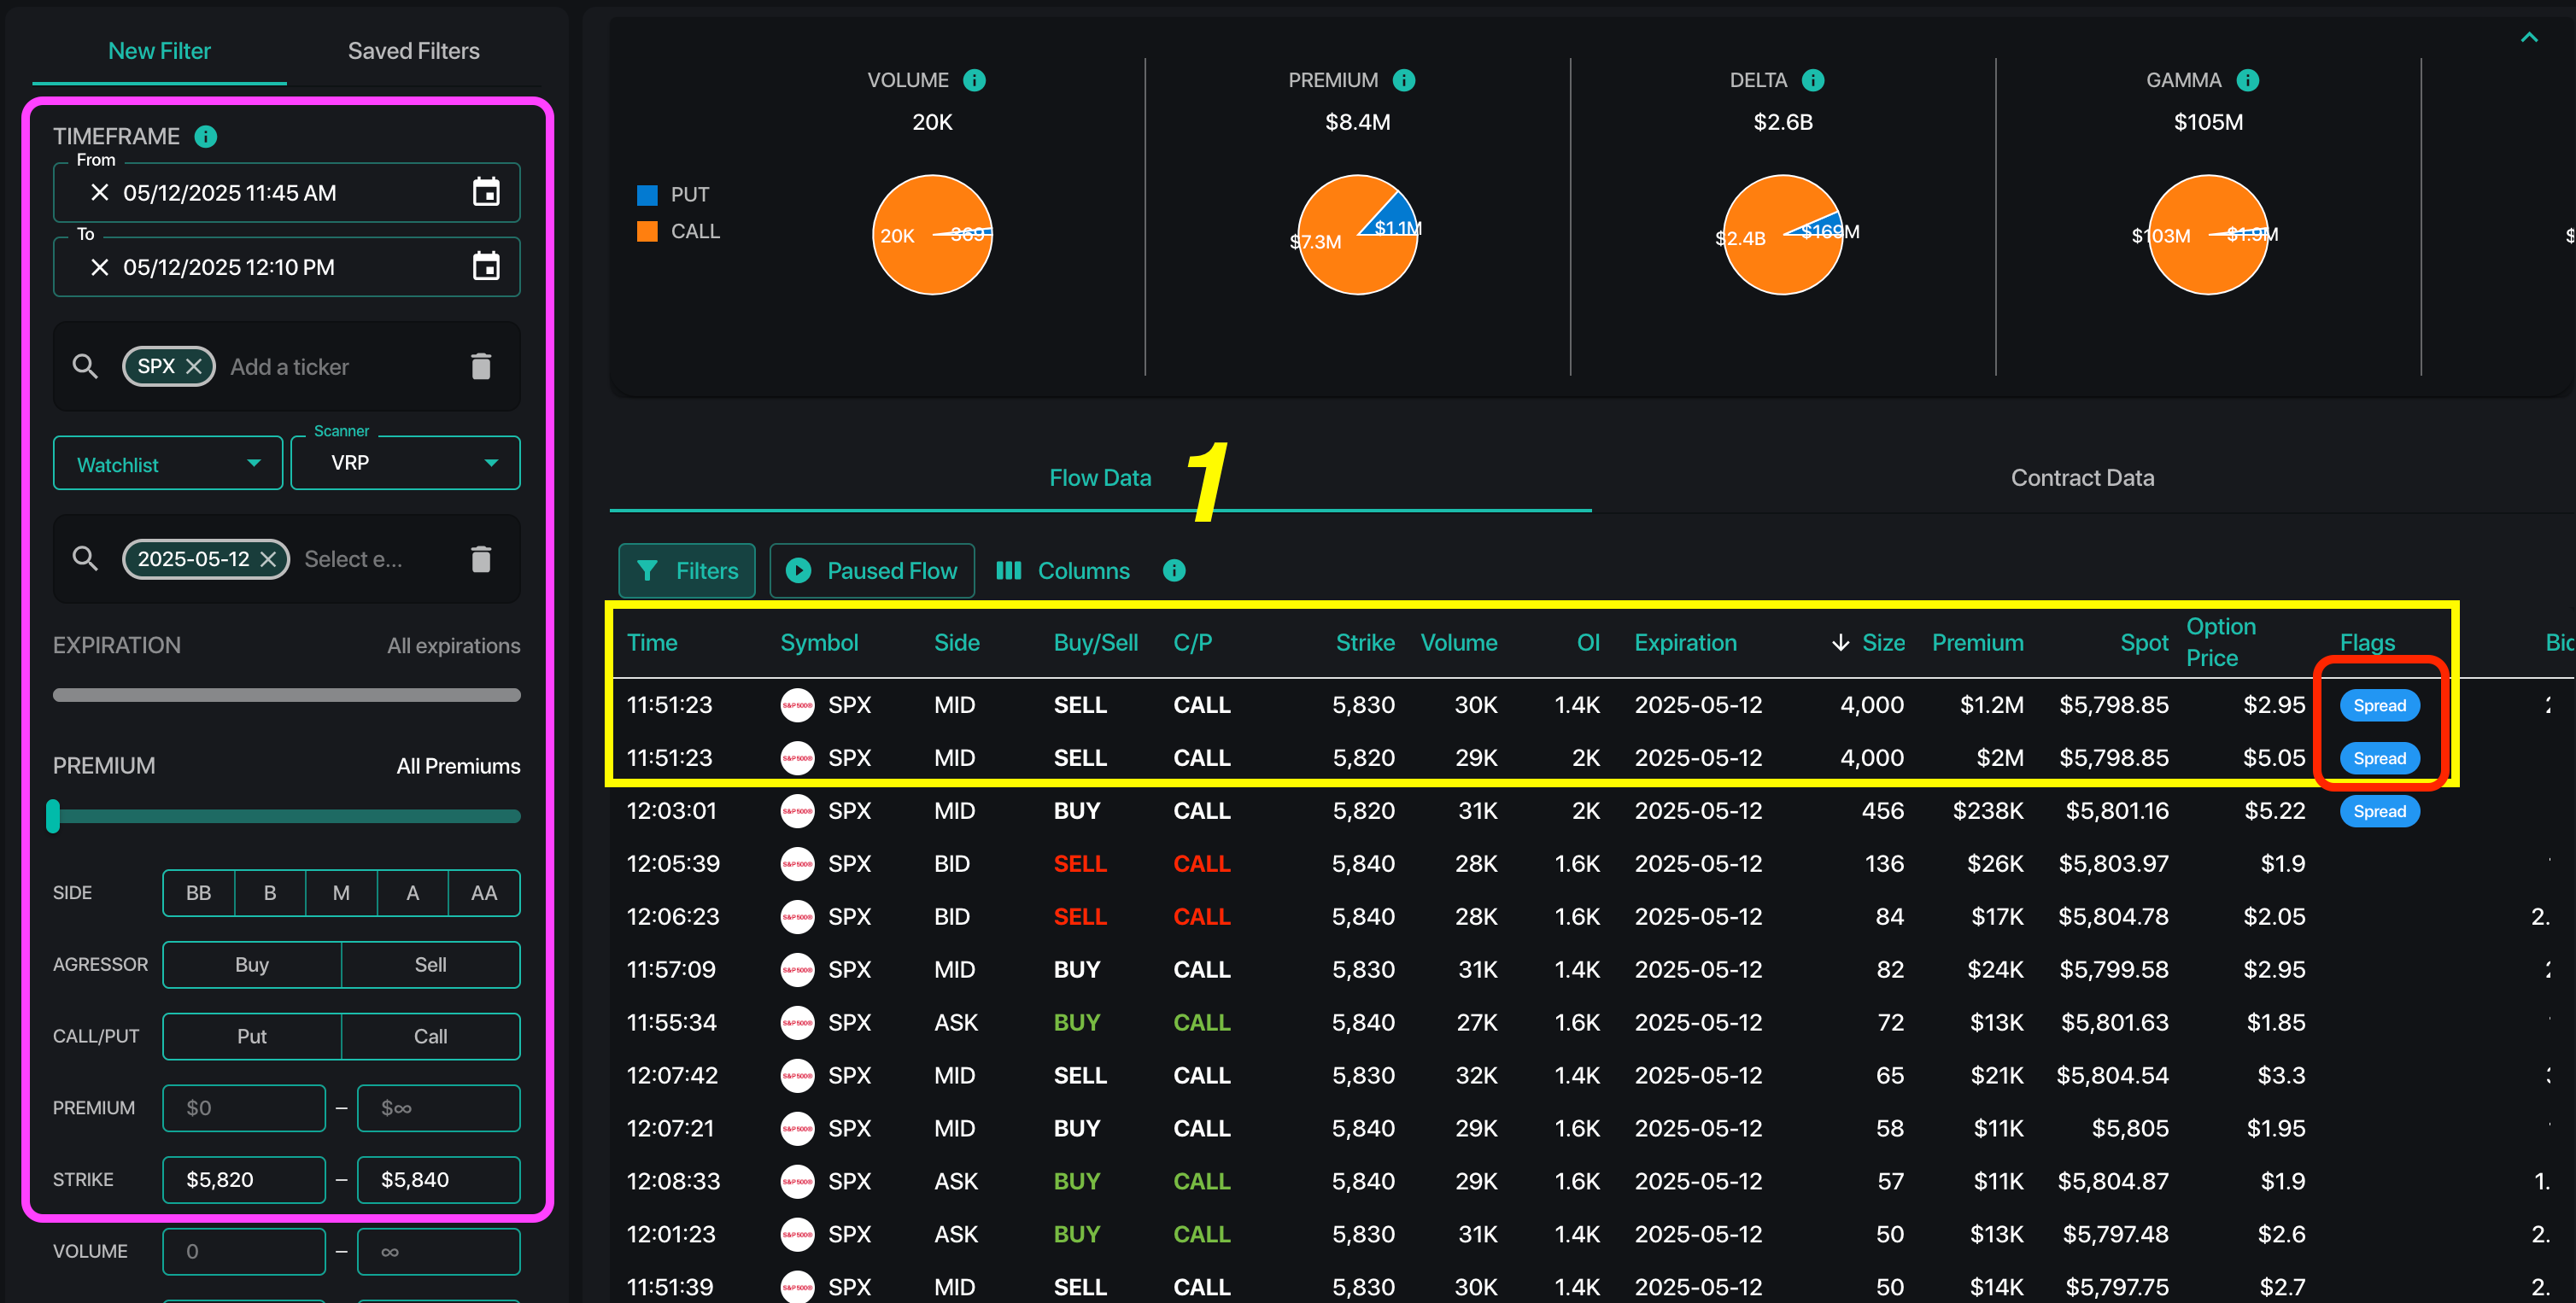
The Contract Data tab (2), aggregates the individual prints over our filtered time period to reveal nearly the same size traded as in the opening trades.
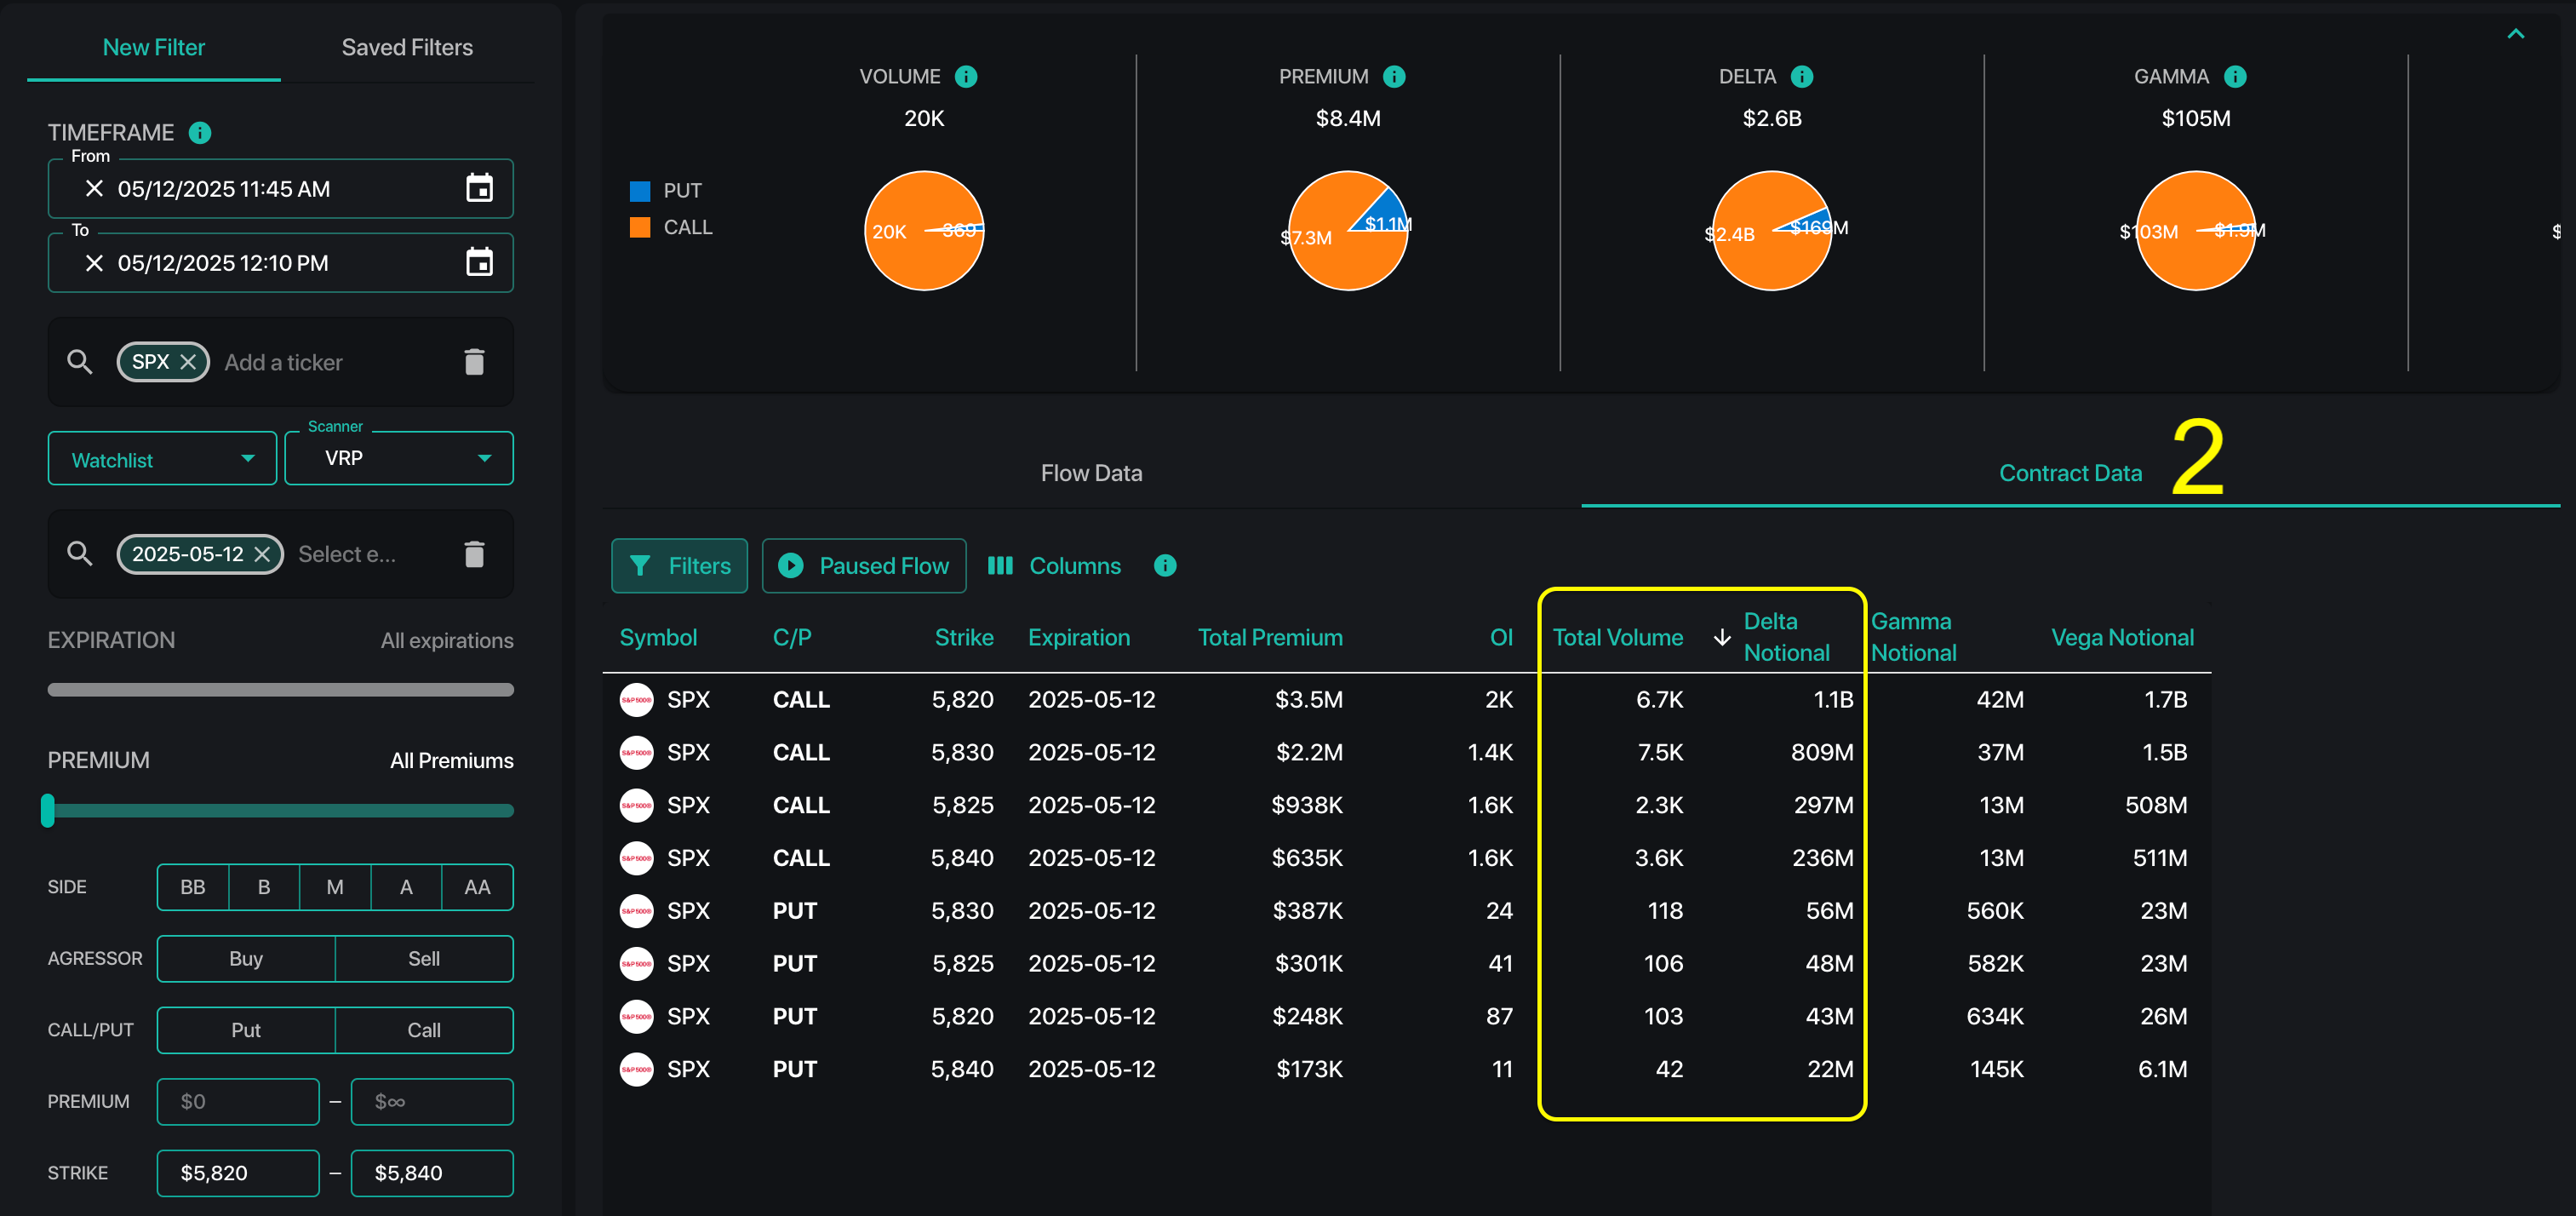
The resistance has been removed.
4: 2:50PM ET
What follows is a substantial 40 handle SPX rally, to intraday highs of 5,840. At which point, the SPX move stalled and started to reverse.
By 2PM ET, the SPX appeared to be attracted to the 5,825-5,830 range, which was the largest gamma zone on our map. We do not think the attraction of the SPX price to the largest 0DTE gamma is a coincidence, as the position is north of $20mm by strike (again, +98th %’ile).
With that, the SPX seemed poised to pin this high-gamma zone, and the SPX traded down from 5,840 to 5,825 (5).
5: 3:45 PM ET
Its at this point, though, that the 5,825 end-of-day gamma-pin comes undone.
As you can see in our TRACE map, the 5,825-5,830 positions were exited just before the close.
Once again, the resistance/pin has been removed.
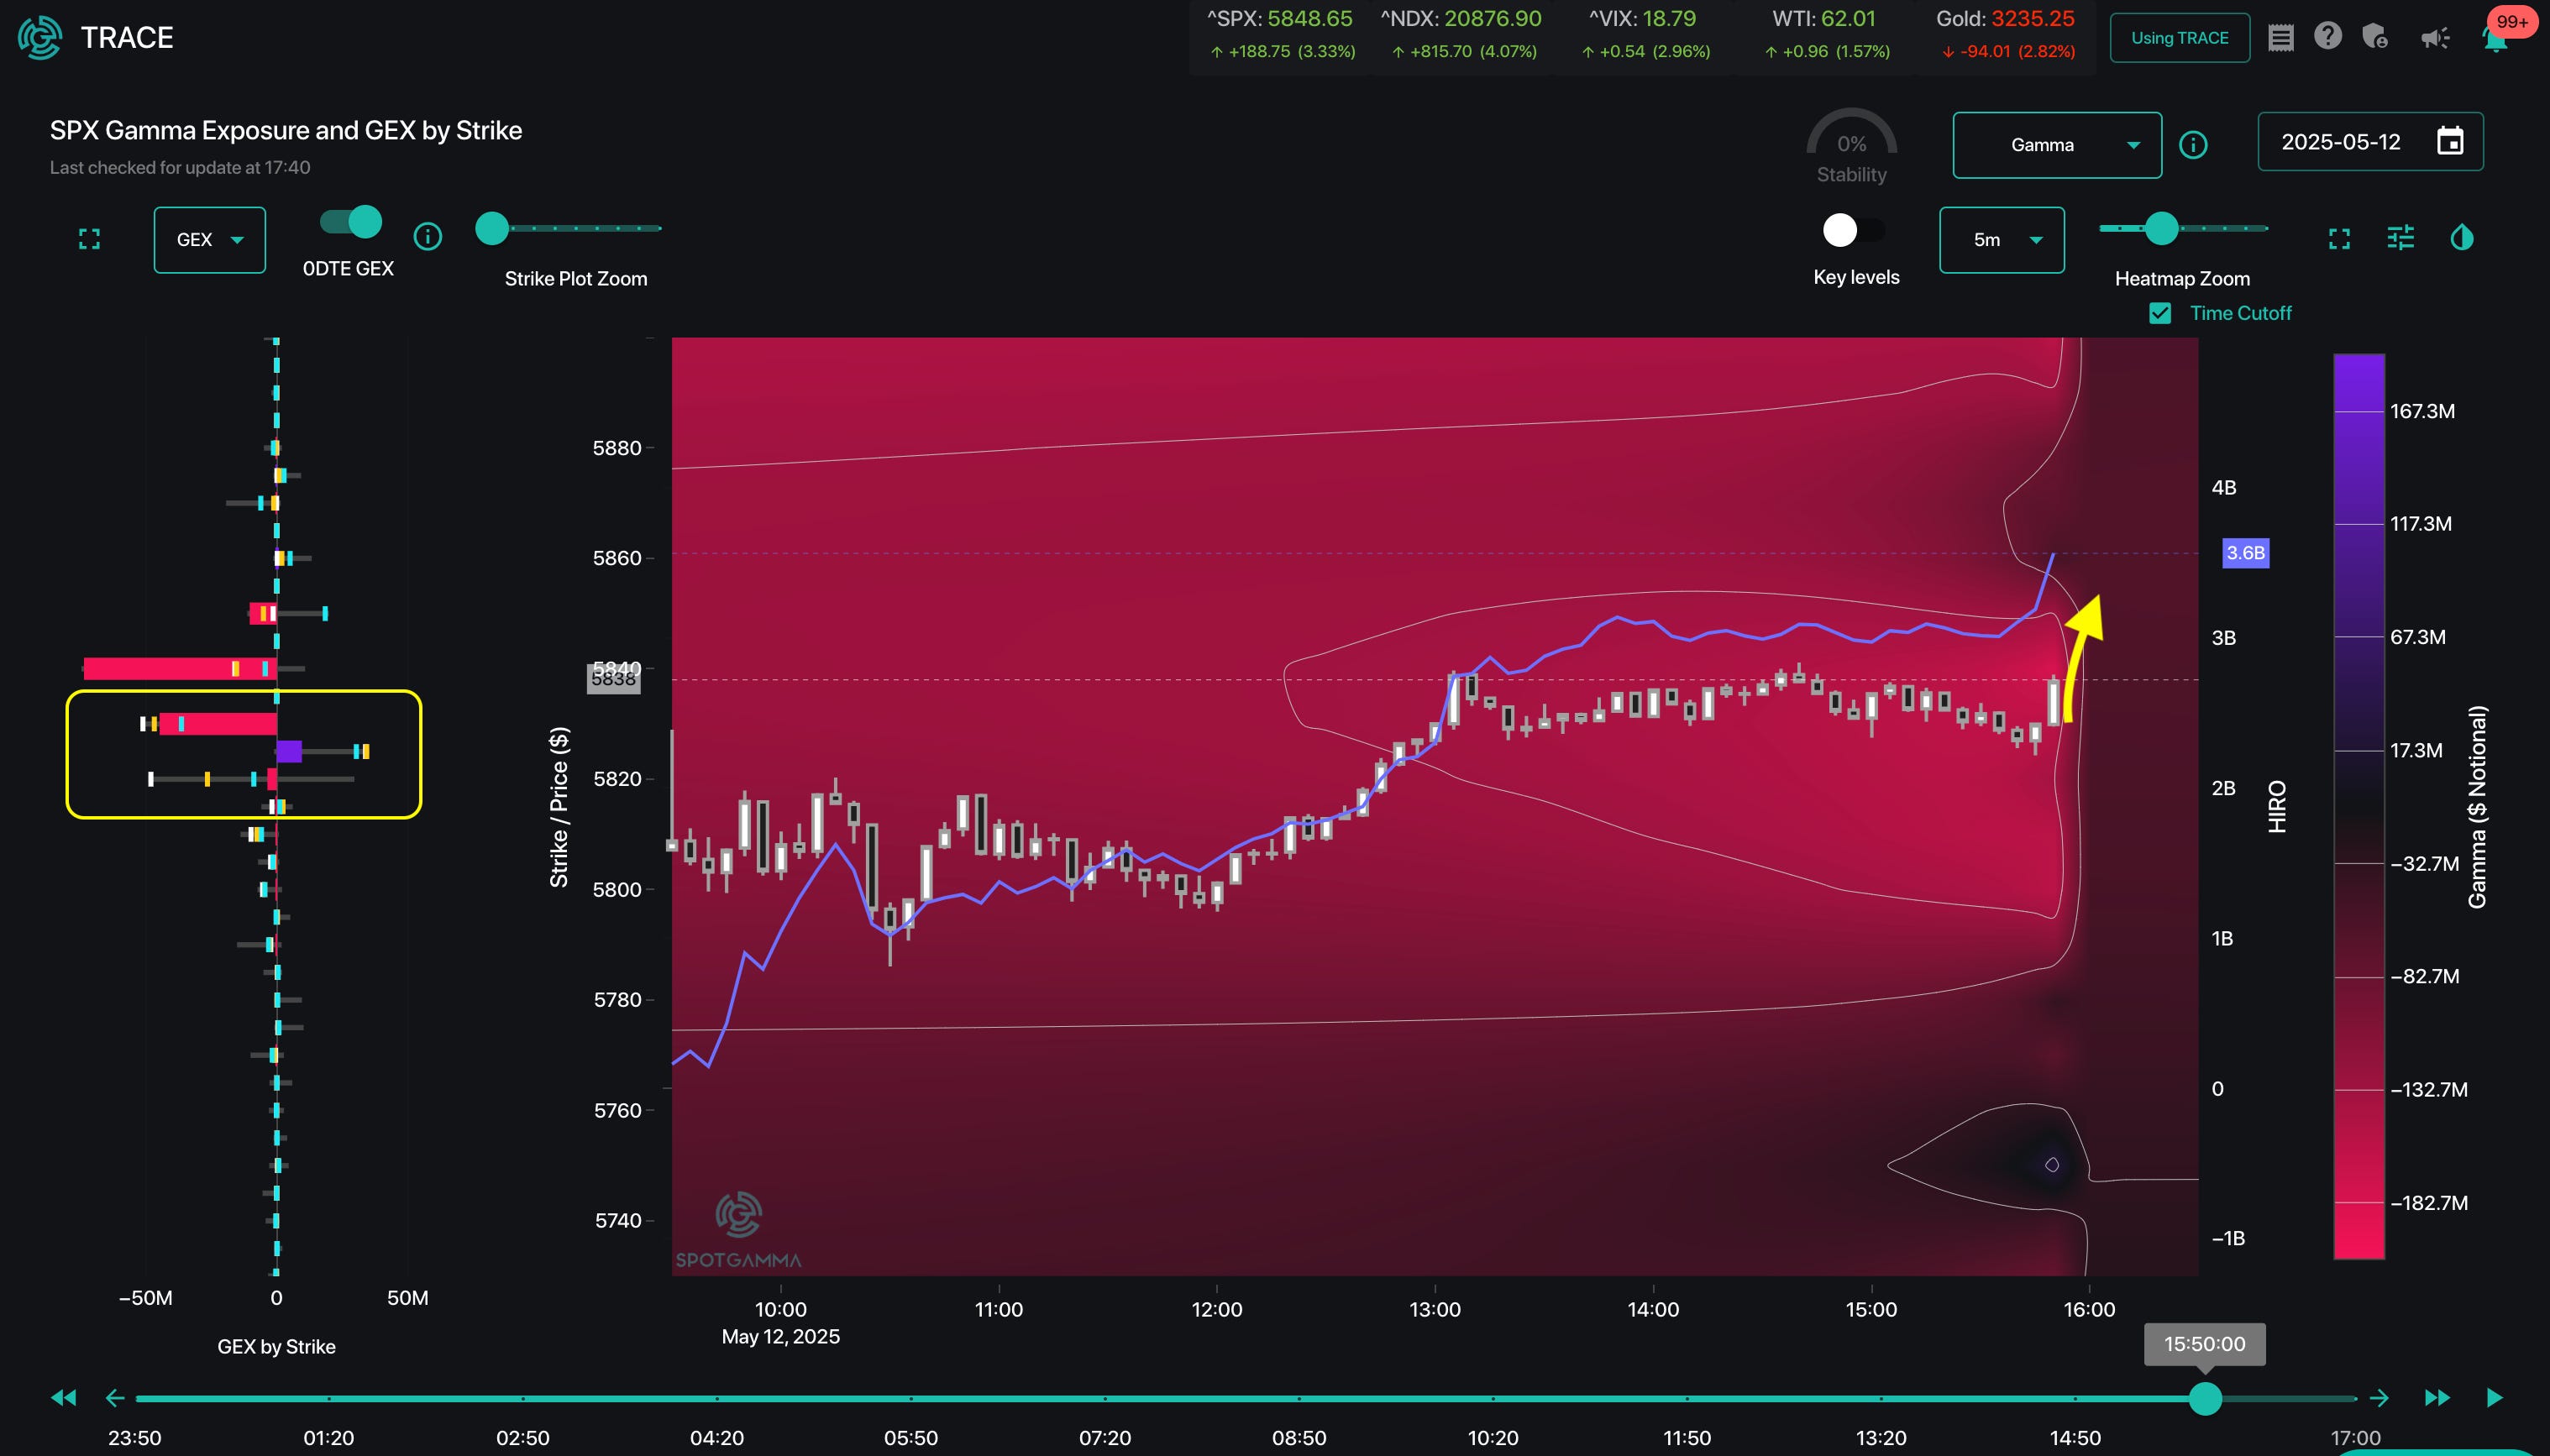
Following this, the SPX ripped 20-handles over the final 15 minutes, to close at the day’s high of 5,844 (5).

Looking back to TAPE, we see there is a flurry of activity at the strikes in this 5,820-5,840 zone, between 3:30 & 3:40PM, that corresponds to the flow marked in TRACE:
Once again, these individual trades summarize to the similar size monitored throughout the day:
The summary of this flow is that is was large MM positive gamma positions that contained the SPX move into both mid-day, and then again into 3:45. We can state this as the largest market rallies on the day both coincided with the removal of these large gamma positions.
How Does 0DTE Trading Impact the Equity Market?
The price action seen on 5/12 is not unique – it is something that we monitor on a daily basis. To this point, we generally believe that 0DTE trading brings mean reversion to SPX price action – meaning the 0DTE flows essentially act to “buy the dip, and sell the rip”. We will be detailing this view in future posts.
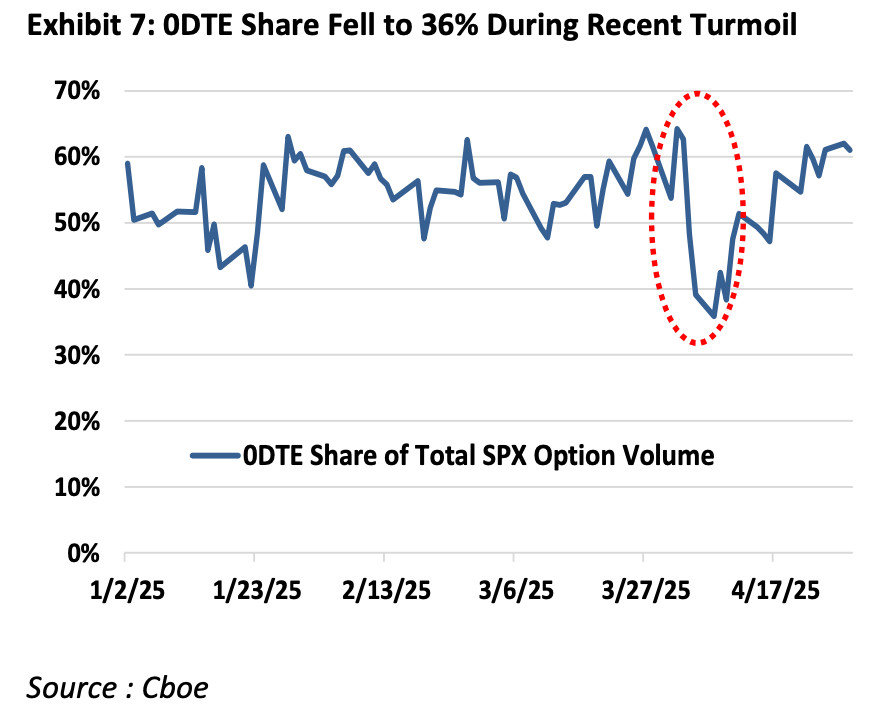
We have seen a pattern of a reduction in 0DTE flows when volatility spikes, as witnessed during the early-April market turmoil. We believe this is both because 0DTE traders step back during times of extreme volatility, and there is an increase in longer dated options activity as longer dated hedge demand increases.
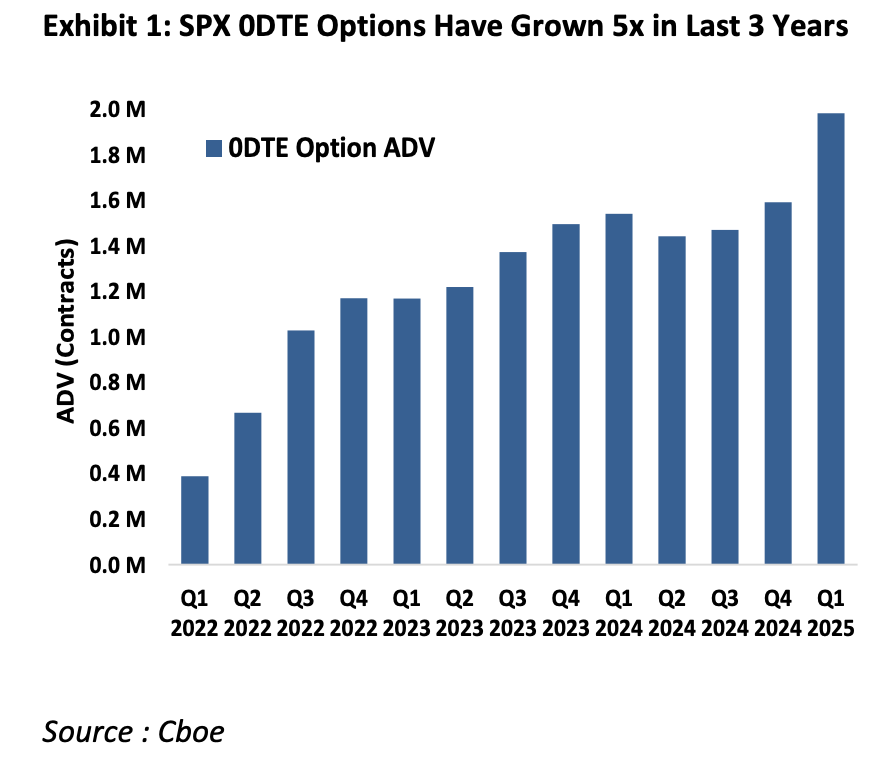
Looking forward, we anticipate that this 0DTE activity & impact may only increase not only as SPX 0TE options volume increases (from the current ADV of 1.9mm contracts/day), but also as 0DTE options are listed for single stocks (as announced by the Nasdaq).
If you are interested in trying out the tools discussed in this post, you can do so via SpotGamma Alpha.