Market Activity: Monday featured an historic stock market reversal wherein the S&P open down 1.5%, declined another 2.5% intraday, then rallied 4% into the close. Two weeks ago we flagged the January 21st options expiration as a catalyst for volatility, and we viewed Monday as a continued “clearing” of large OPEX hedges.
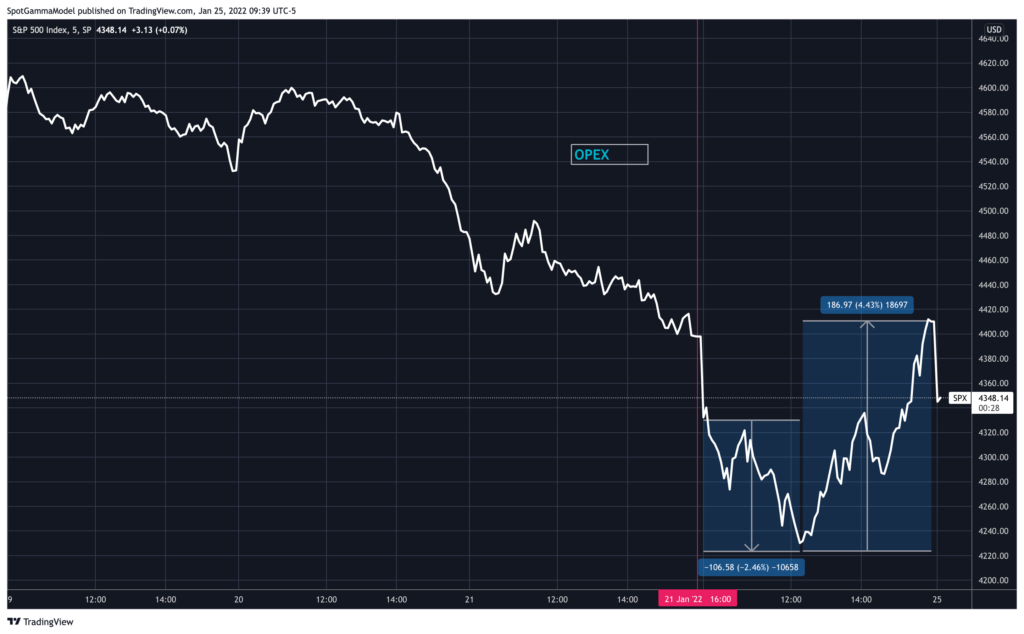
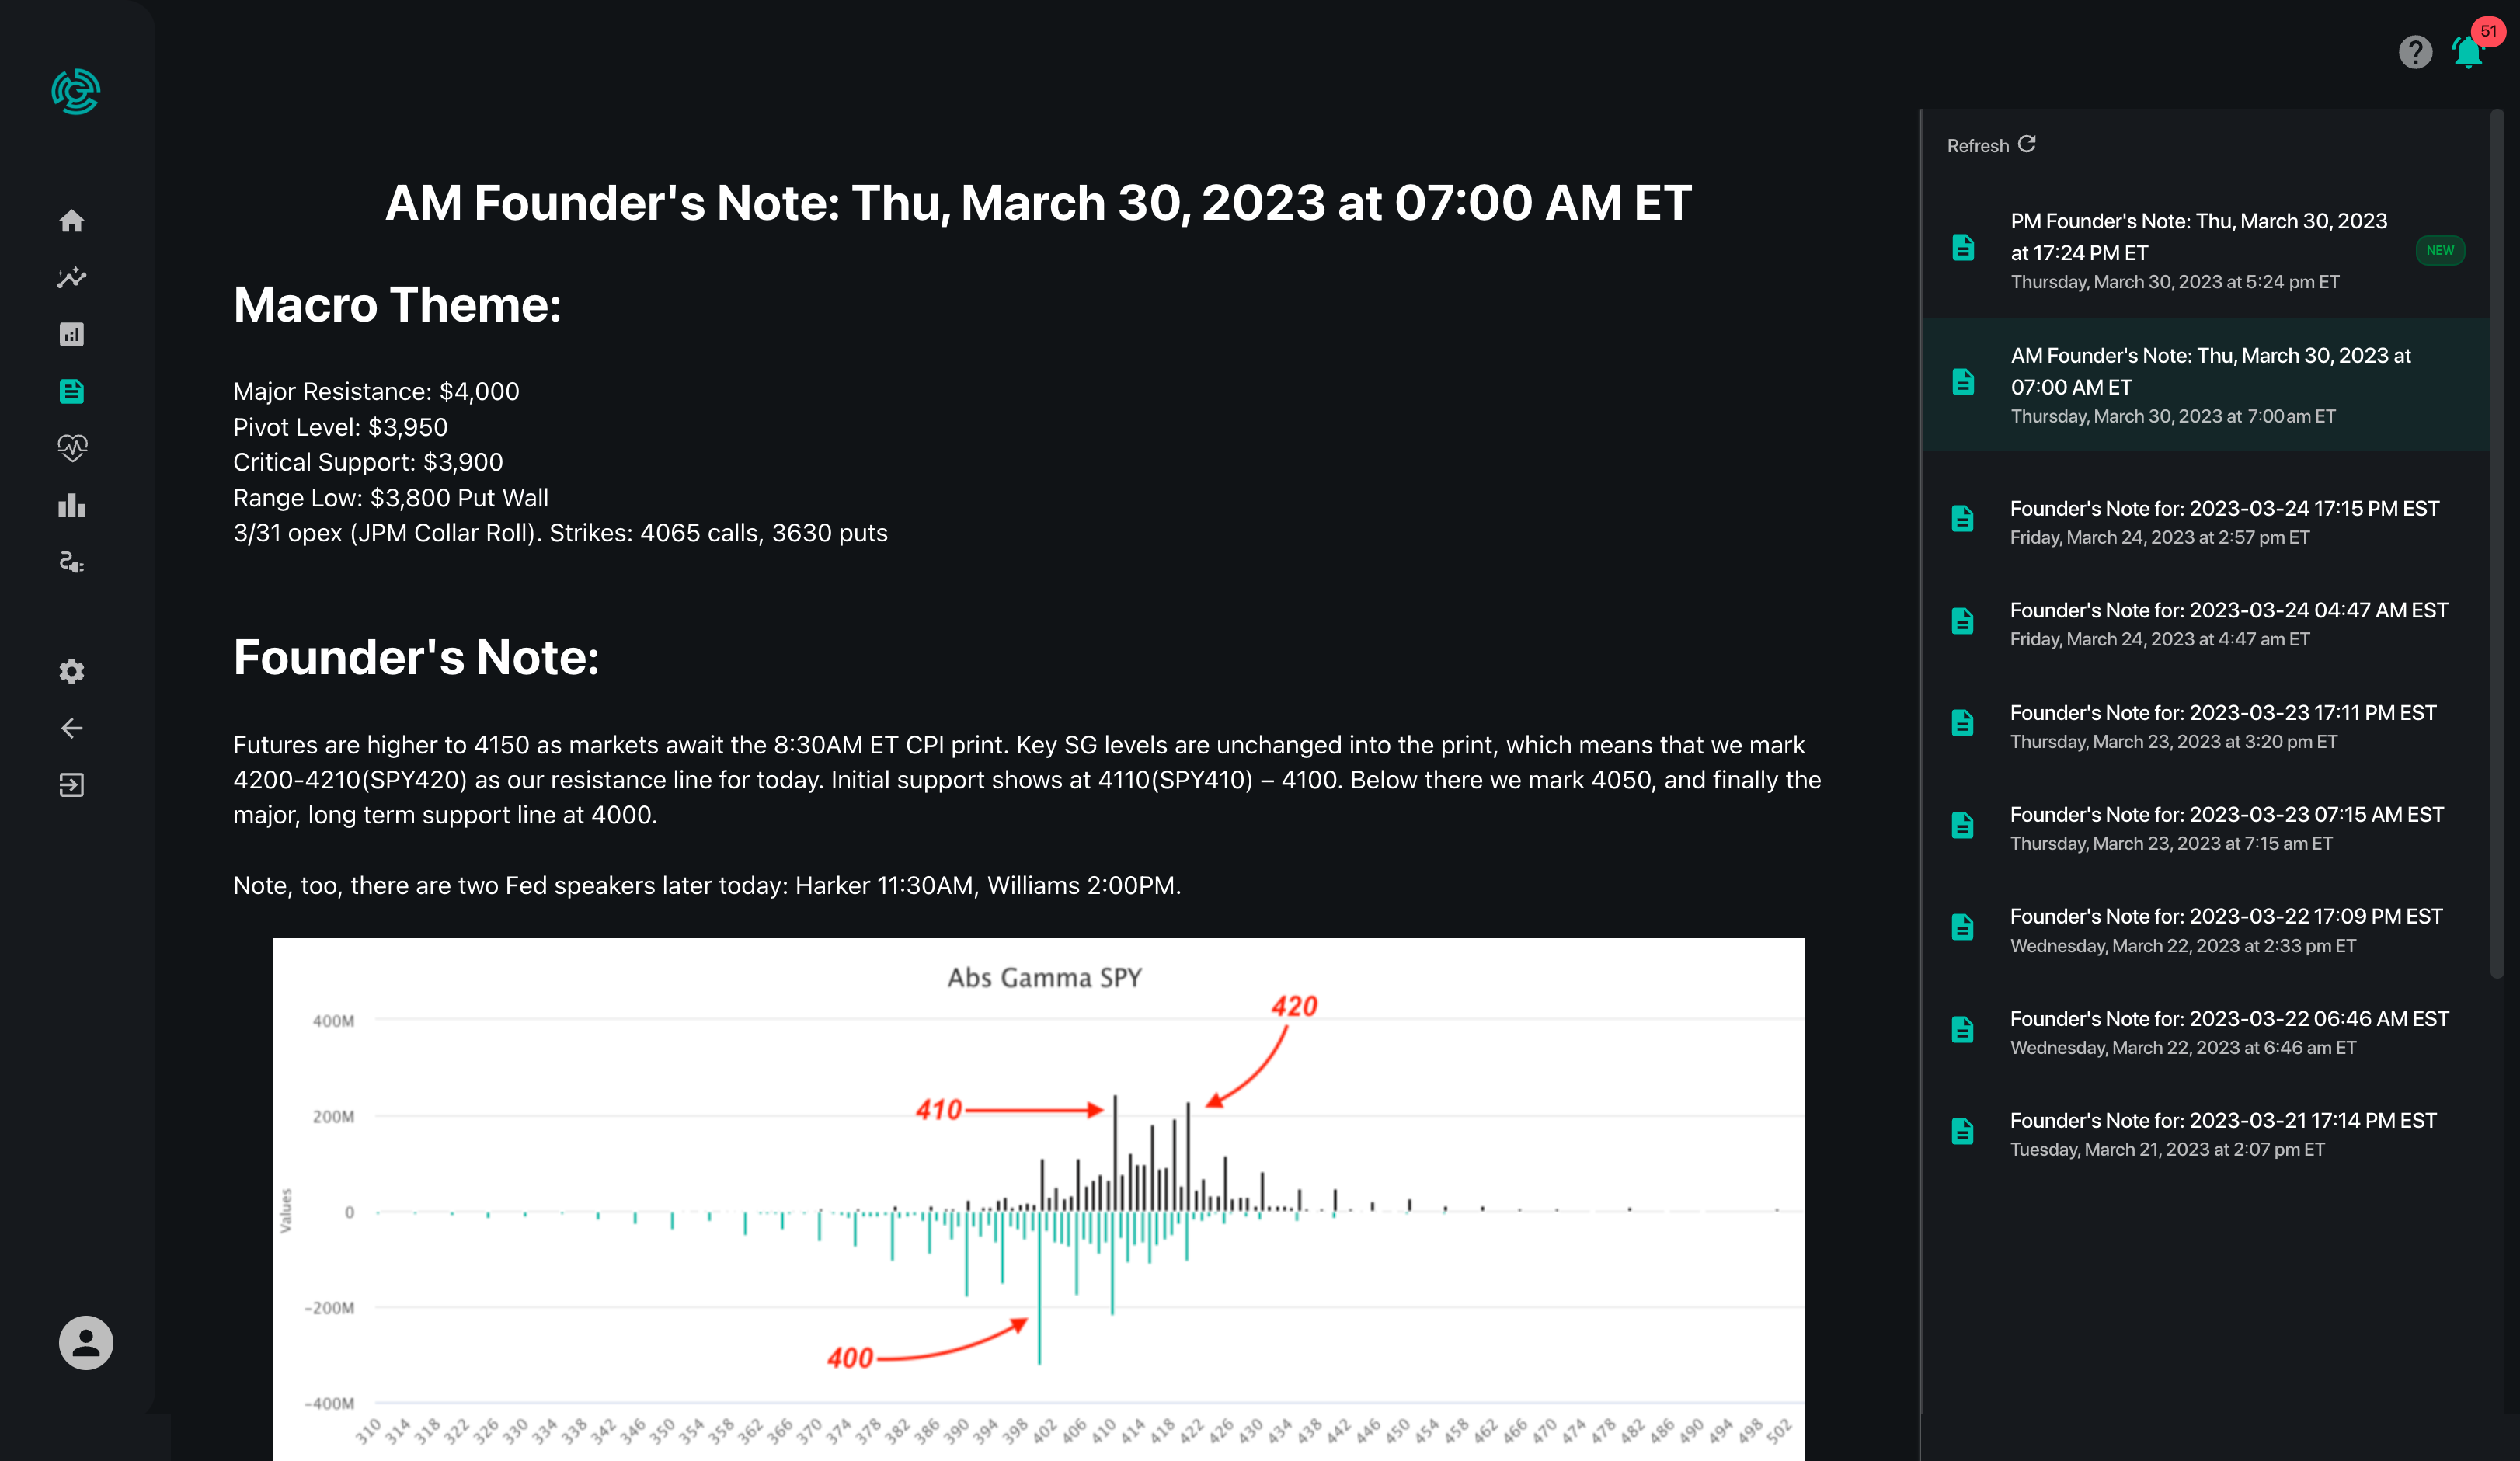
Market Backdrop: In addition to the expiration, our models also indicated that there was a very large negative gamma position on Monday, which implied that any market selling (regardless of source) would trigger options dealers to sell. Conversely buying would induce dealers to cover their short hedges (if you’re new to gamma hedging, go here).
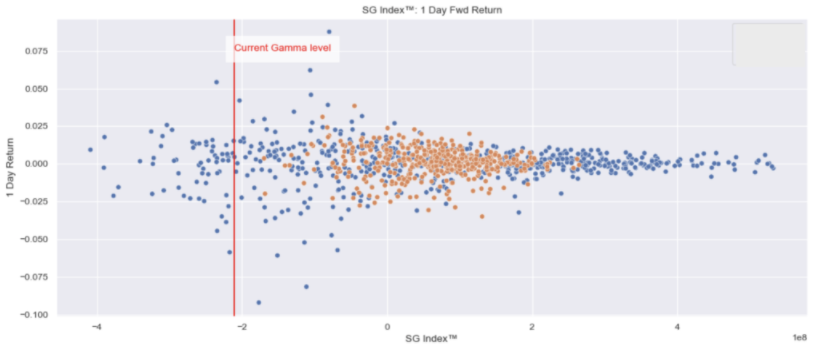
Each day for our subscribers, SpotGamma [SG] measures the amount of total gamma in the S&P. We’ve plotted that below, vs. the forward 1-day return in the S&P500. As you can see below, the distribution of S&P prices expands markedly as the SG Index shifts from 1 down to -2.
We believe this correlation is due to the forces of gamma hedging: negative gamma implies that dealers hedging flows go with the market. This flow expands volatility as dealers hedge the market in its prevailing direction. Accordingly, as the SG Index shifts more negatively it suggests that the dealer’s negative gamma position expands, resulting in increased volatility.
Dynamic One: When the markets drop sharply, dealer’s protective deep out of the money puts provide support.
You may note in the chart above, that when the SG Index declines below -2 the distribution of S&P returns consolidates. That is to say, for example, the S&P seems less volatile with the SG Index at -3, then when the index is at -1.
This runs a bit contrary to the idea that more negative gamma implies higher volatility…so what gives?
In general, we believe that options dealers are short put options. To hedge these put positions, options dealers can hedge small movements by adjusting their delta. The most basic way to do this delta hedge adjustment is to buy and sell futures/stock. This is considered a “linear” hedge, as when you buy or sell futures, the return on that hedge is 1:1 with the stocks price.
However, options are convex instruments. This means that when markets move drastically, the change in option values is non-linear.
To protect against significant downside, we believe most options dealers own tail risk protection. That is to say that while they are offering at or near- the-money put options, they likely always own deep out-of-the-money options that help protect their portfolio in the event of a crash.
This excellent FT piece on Jane Street gives a glimpse into this (h/t Eugene):
Even beyond every trading desk’s routine hedging of positions, Jane Street at a company level spends $50m-$75m a year on put options — derivatives that pay out if markets slump. In early February, the firm aggressively ramped this up to ensure it could still confidently keep trading even if turmoil hits the markets.
“Our basic service, standing ready to buy and sell ETFs, options and bonds, is even more critical in times of stress,” says Josh Kulkin, one of its top traders. “Because we bought all that extra protection we didn’t have to worry about the extreme moves, and were prepared to provide liquidity in an outsized way.”
Using this logic, when the downside puts gain value, they may reduce the need to delta hedge. In turn, dealers may be able to advantageously reduce delta hedging (sell less), and supply markets with more liquidity (buy more stock). This could serve to reduce volatility.
Dynamic Two: Dealers were protected heading into this specific move (example below).
The second piece of this lower bound, comes from our gamma hedging models. Below we’ve posted our gamma model from 1/24, and you can see that the gamma profile of the QQQ options complex flattens out when the QQQ approaches $340 (left side, red box). This suggests that the dealer gamma hedging requirements reduce as the market drops through $340.
In other words, from a delta perspective, they are hedged.
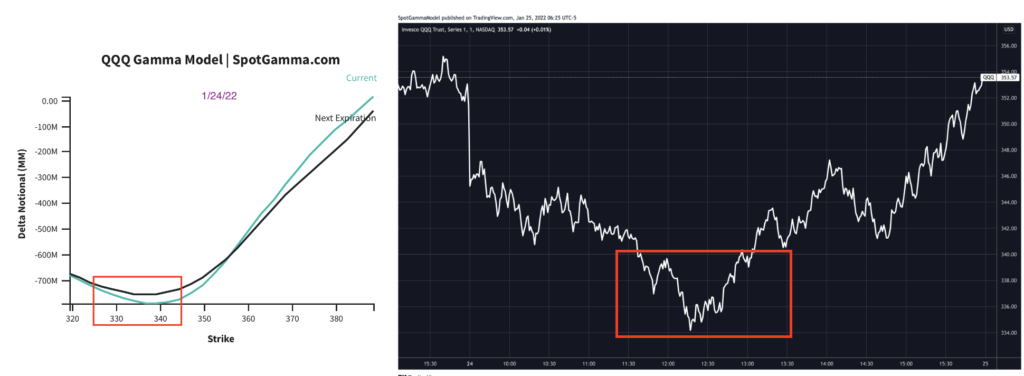
This $340 level happened to coincide with where there was a big reversal in the QQQ’s yesterday (above, right chart). In theory this reduction in gamma allowed for a reduction in volatility as QQQ shifted <=340. This coincides with the level wherein we saw large put selling, too.
Conclusion: Combined we think that the extreme move in equities hit its lower bound. The put positions that were on, in a way, became fully hedged which may have resulted in Mondays violent “snap back rally”.
Next: We think that its not until after the FOMC that put positions are closed and/or rolled. This could change hedging profiles, and may shift the lower bound…lower. We will update our levels daily and be live on Thursday afternoon to discuss the next phase with our good friend, Darius Dale. – https://www.youtube.com/watch?v=hd6uM-Y3Aew