The following is a guest post from Doug Pless.
When I trade futures, I begin my morning preparation by gathering information to help develop a thesis for the day. My thesis includes the following items:
- Directional bias
- Anticipated volatility
- Trading range for the day
My primary source of information is the SpotGamma AM Report. For ES futures, I note gamma levels, the SpotGamma Imp. 1 Day Move, the SpotGamma Gamma Index, and Gamma Notional for SPX and SPY.
The SpotGamma Imp. 1 Day Move provides a one day estimate of SPX movement. It is an estimated one standard deviation range for the day.
The SpotGamma Gamma Index is a proprietary measurement of the total amount of gamma in the underlying asset. Based on historical data, a large negative number indicates volatility may be high. A large positive number indicates volatility may be low.
Gamma Notional is the sum of call gamma minus the sum of put gamma. Typically, when gamma is positive market makers hedge against market movement, buying down moves and selling rallies. When gamma is negative, market makers hedge with market movement, selling down moves and buying rallies.
I also look at the Vanna Model for SPX. This graph shows how market maker delta exposure may shift as price and implied volatility (IV) move up or down. The slope of the lines indicates how aggressively market makers may have to buy or sell ES futures to hedge their delta exposure as price and IV change.
Based on this information, the anticipated volatility and trading range for the day are often clear. It is sometimes more difficult to develop a directional bias. As I discussed previously, I use the HIRO Indicator to confirm my thesis when trading stocks. HIRO can also be used to help develop a thesis for directional bias for futures in the first minutes of trade after the RTH open. The two examples below show how I used HIRO to confirm bullish and bearish trades on days with almost identical values for the metrics listed above.
Trade Example #1: August 25, 2021
On August 25, the following metrics for SPX and SPY were shown in the AM Report:
- SPX SpotGamma Imp. 1 Day Move: 0.7% (+- 31.0 pts.)
- SPX SpotGamma Gamma Index: 1.81
- SPY SpotGamma Gamma Index: 0.26
- SPX Gamma Notional: $498 MM
- SPY Gamma Notional: $1111 MM
The SPX Vanna Model for August 25 showed an upside skew indicating market makers would likely need to sell ES futures to hedge their delta exposure as price moved up toward 4500. The SPX Vanna Model for August 25 is shown below.

Based on the large SpotGamma Gamma Index, large positive Gamma Notional for SPX and SPY, and skewed Vanna Model for SPX, I was looking for a lower volatility day with a narrow trading range. Market makers would likely be trading against the directional movement of the market rather than with it. A directional bias was not clear.
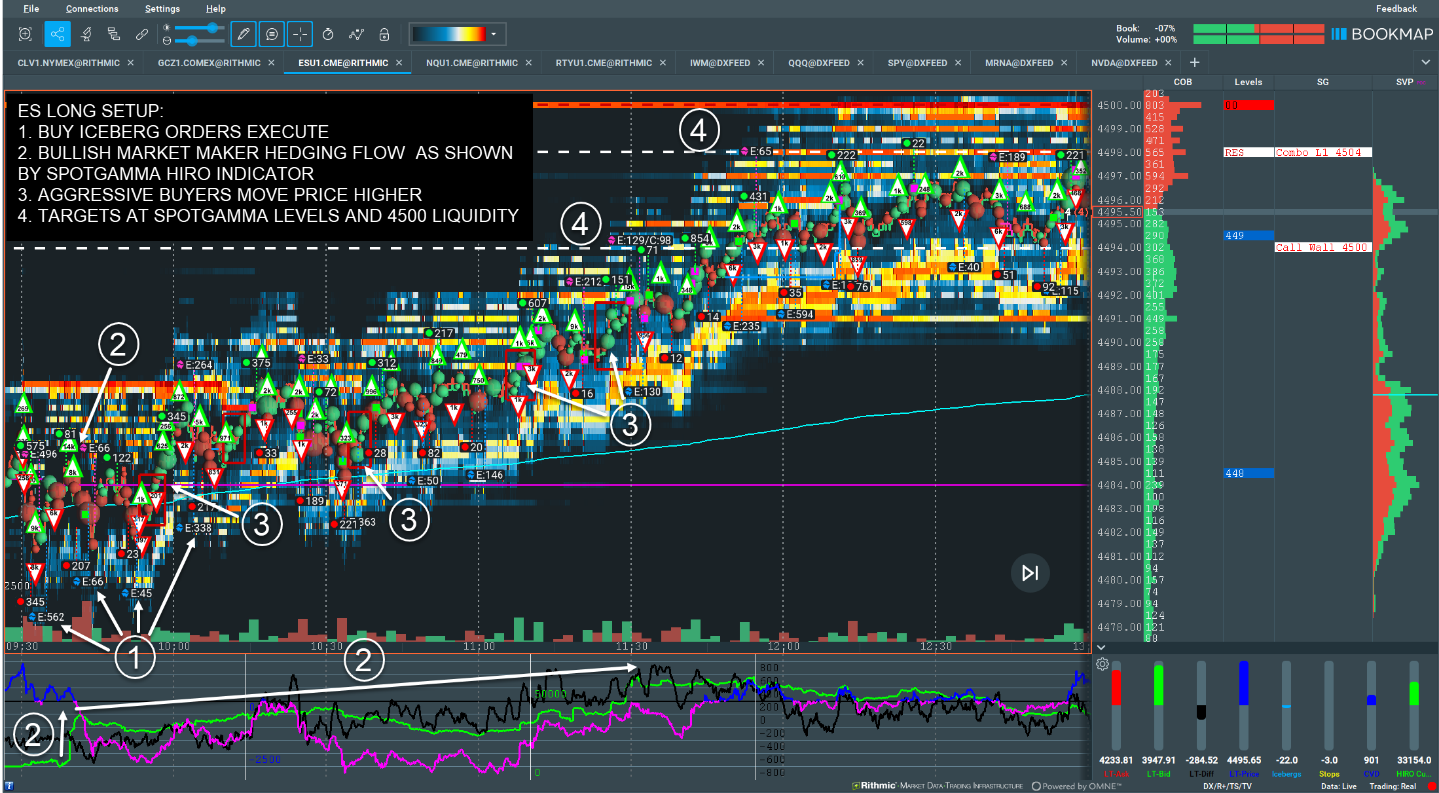
Soon after the cash open, a number of large bullish options trades helped to initiate a move higher, as shown by the HIRO Indicator in the Bookmap chart below. The indicator showed that market makers were buying futures to hedge the bullish option trades. There were several opportunities to enter long positions as the hedging flow remained bullish and price continued to rise. ES finally stalled between the Call Wall and Combo L1 level as the hedging flow turned bearish.
Trade Example #2: August 26, 2021
On August 26, the following metrics for SPX and SPY were shown in the AM Report:
• SPX SpotGamma Imp. 1 Day Move: 0.67% (+- 30.0 pts.)
• SPX SpotGamma Gamma Index: 1.93
• SPY SpotGamma Gamma Index: 0.27
• SPX Gamma Notional: $495 MM
• SPY Gamma Notional: $1142 MM
Just like the prior day, the SPX Vanna Model for August 26 showed an upside skew indicating market makers would likely need to sell ES futures to hedge their delta exposure as price moved up toward 4500. The SPX Vanna Model for August 26 is shown below.

Again, based on the large SpotGamma Gamma Index, large positive Gamma Notional for SPX and SPY, and skewed Vanna Model for SPX, I was looking for a lower volatility day with a narrow trading range. Market makers would likely be trading against the directional movement of the market rather than with it. A directional bias was not clear.
In direct opposition to August 25, several large bearish options trades helped to initiate a move lower soon after the cash open, as shown by the HIRO Indicator in the Bookmap chart below. The indicator showed that market makers were selling futures to hedge the bearish option trades. There were several opportunities to enter short positions as the hedging flow remained bearish and price continued to fall to the L2 level (noted as support in the AM Report) and the liquidity at 4465.
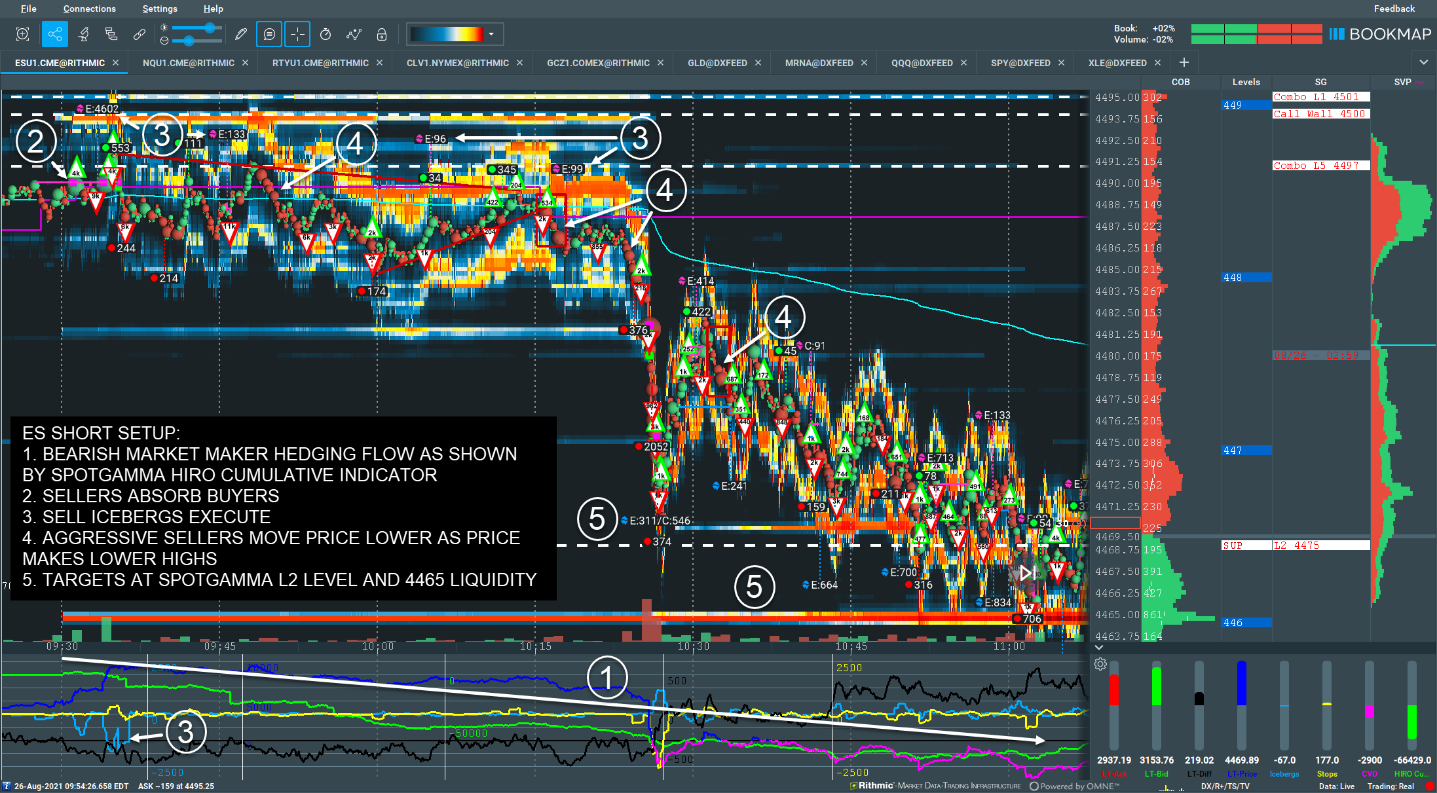
In the two trade examples, the values for the SpotGamma Imp. 1 Day Move, the SpotGamma Gamma Index, and Gamma Notional were nearly identical. I anticipated lower volatility and a narrow trading range on both days. Watching the options trades and the corresponding market maker hedging flow as shown by the HIRO Indicator in the first 15 – 30 minutes of trade helped to confirm my directional bias. Based on HIRO, I was looking for bullish trades on August 25 and bearish trades on August 26.
For further definitions and information on the terms used in this article, please see the SpotGamma Support Center for a list of dozens of SpotGamma proprietary terms, as well as context for common market terminology.
SpotGamma Products Used:
- SpotGamma Pro
- HIRO Indicator (available now on Bookmap)