The following is a guest post from Doug Pless.
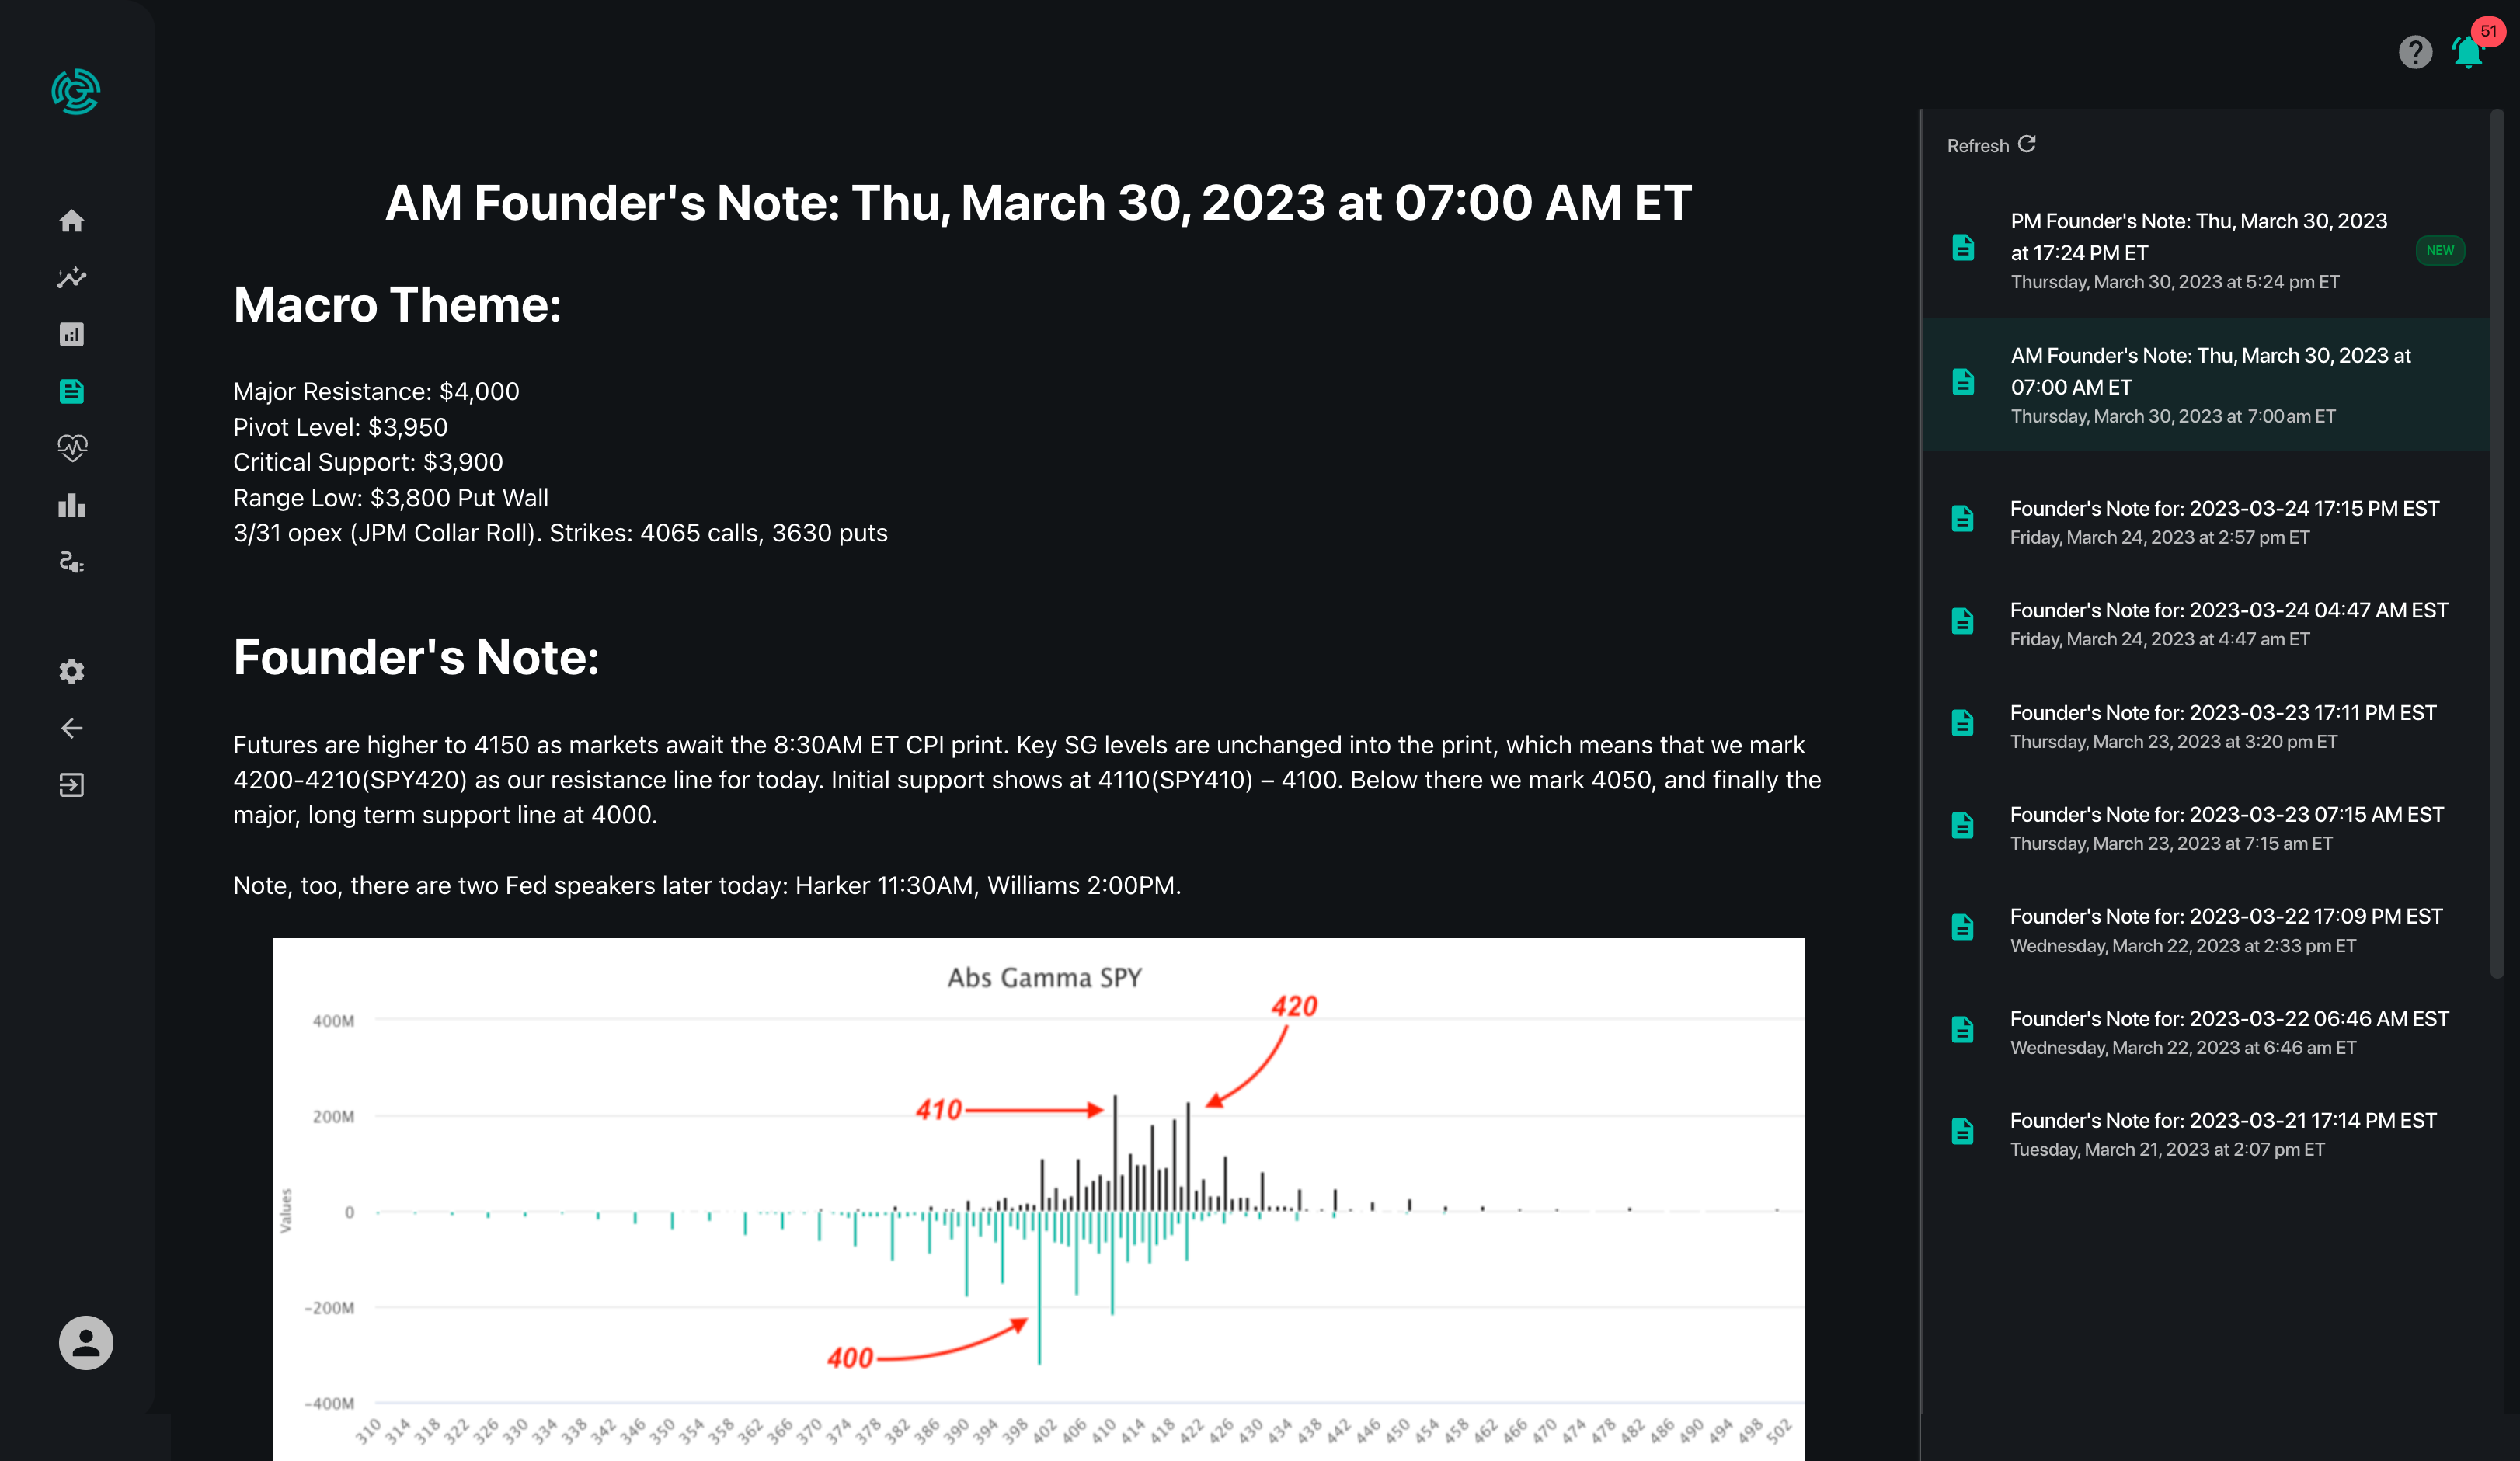
As I discussed previously, I begin my morning preparation by reading the SpotGamma AM Report when I plan to trade futures. For ES futures, I note gamma levels, the SpotGamma Index, and Gamma Notional for SPX and SPY.
The SpotGamma Gamma Index is a proprietary measurement of the total amount of gamma in the underlying asset. Based on historical data, a large negative number indicates volatility may be high. A large positive number indicates volatility may be low.
Gamma Notional is the sum of call gamma minus the sum of put gamma. Typically, when gamma is positive market makers hedge against market movement, buying down moves and selling rallies. When gamma is negative, market makers hedge with market movement, selling down moves and buying rallies.
I also look at the Vanna Model for SPX. This graph shows how market maker delta exposure may shift as price and implied volatility (IV) move up or down. The slope of the lines indicates how aggressively market makers may have to buy or sell ES futures to hedge their delta exposure as price and IV change.
Based on this information, I develop a thesis regarding directional bias, anticipated volatility, and trading range for the day. An example of how I used this information to plan and execute a trade in ES futures is shown below.
Trade Example: August 19, 2021
On August 19, the following metrics for SPX and SPY were shown in the AM Report:
- SPX SpotGamma Gamma Index: -0.10
- SPY SpotGamma Gamma Index: -0.09
- SPX Gamma Notional: -$579 MM
- SPY Gamma Notional: -$423 MM
- SPX Volatility Trigger: 4420
- SPY Volatility Trigger: 440
- SPX Zero Gamma: 4422
The SPX Vanna Model for August 19 showed a significant downside skew indicating market makers would need to sell ES futures to hedge their delta exposure as price moved down. The model also showed that market makers would likely need to buy ES futures as price moved up. The SPX Vanna Model for August 19 is shown below.

Based on the negative SpotGamma Gamma Index and large negative Gamma Notional for SPX and SPY and skewed Vanna Model for SPX, I was looking for a higher volatility day with a wider trading range. Market makers would likely be trading with the directional movement of the market rather than against it.
As the day played out, price rallied from the open and retraced to VWAP around 10:45 A.M. ET. As market maker hedging flow shifted from bearish to bullish as shown by the HIRO Indicator in the Bookmap chart below, my directional bias was bullish. Assuming price would continue to move up to 4400, and eventually the SpotGamma levels above, I was looking for long entries. Several long entry points are shown on the chart. The locations of the gamma levels are noted in a Cloud Notes column and marked with white dashed lines in the chart.

For further definitions and information on the terms used in this article, please see the SpotGamma Support Center for a list of dozens of SpotGamma proprietary terms, as well as context for common market terminology.
SpotGamma Products Used:
- HIRO Indicator via SpotGamma Alpha