The following is a guest post from Doug Pless.
When I plan to trade stocks for the day, I begin my morning preparation by opening my watchlist in Equity Hub. I look at the Key Gamma Strike, Hedge Wall, and other metrics and compare the values with the previous values for the last five days. I also look at the SG Momentum Indicator and the Dark Pool Indicator for stocks that I am considering trading during the day. Please see an article that I posted previously for a detailed example of how I use these SpotGamma tools to prepare to trade stocks.
The focus of this article is how I find, enter, and manage stock trades during the day.
After the market opens, I use SpotGamma HIRO, a recently introduced, web-based version of the HIRO Indicator, to find trades. I use Bookmap and Bookmap HIRO to enter and manage trades.
HIRO Indicator
HIRO (Hedging Impact Real-Time Options) tracks option trades in real-time and displays the hedging impact of the trades on charts and in tables. As an example, if traders buy calls and sell puts in a stock, market makers take the opposite side of the trades, selling calls and buying puts. Since market makers want to remain delta neutral, they buy stock to hedge their delta risk. This market maker hedging activity is a key driver of order flow in many stocks. SpotGamma and Bookmap HIRO display this hedging pressure for stocks and equity indices.
SpotGamma HIRO
Prior to the introduction of SpotGamma HIRO, the HIRO Indicator was only available on the Bookmap platform. The new web-based version of HIRO provides traders with additional information to help their trading decisions.
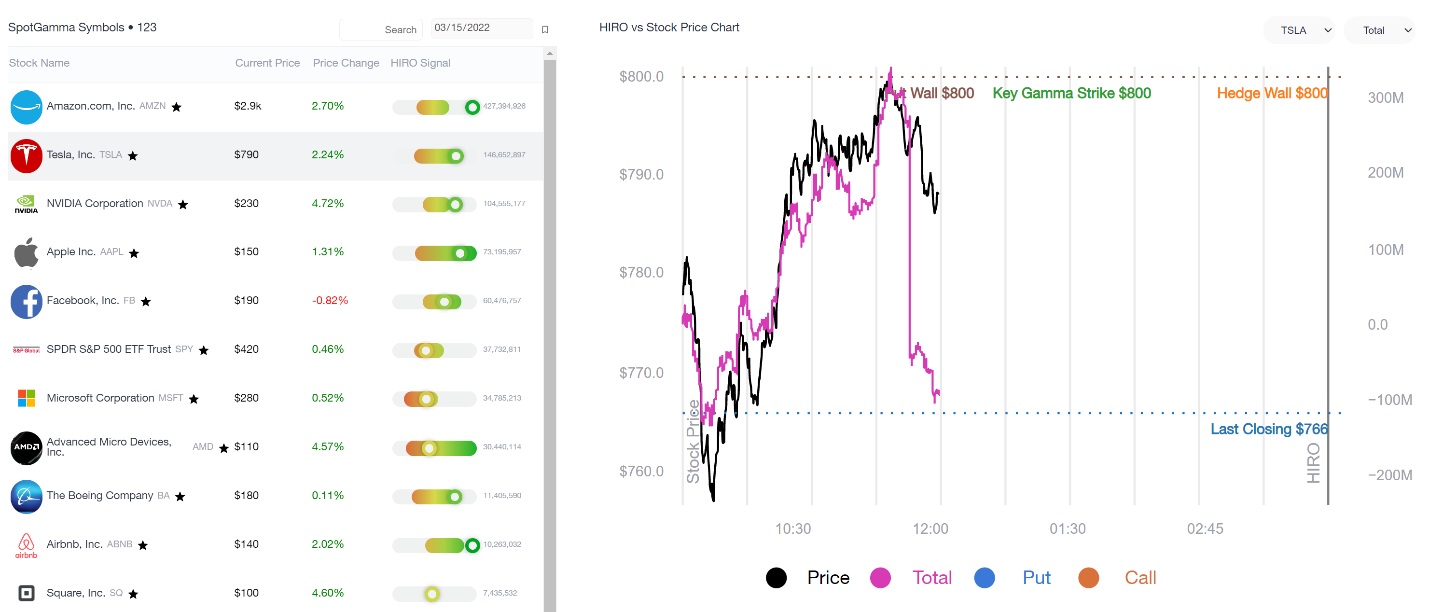
As shown in the image below, SpotGamma HIRO shows a list of stocks (either all available symbols or a customized watchlist), the current price, price change, HIRO Signal, and the current value of the HIRO Indicator. The HIRO Signal shows how the current value compares to the most recent 5-day and 30-day ranges. The list can be sorted by any of the column headers. The chart on the right shows the current stock price (black line) and the Total Aggregate HIRO Reading (purple line). The chart can also be set to show separate lines for call (orange line) and put (blue line) HIRO readings, as will be shown in the examples below. Please see the SpotGamma Support Center for more information on the HIRO Indicator.
Trading Process
After the market opens, I scan my watchlist for strong HIRO Signals, either positive or negative, in SpotGamma HIRO. My watchlist includes stocks from a variety of sectors with high Average True Range, significant options trading activity, and price action that is consistently driven by options and market maker hedging activity.
As the day progresses, I look for three scenarios. First, trend continuation – Total Aggregate HIRO Reading moving in the same direction as price. For example, HIRO shows traders are buying calls and selling puts, and price is moving up. In this case, I would look for a long entry. Second, trend reversal – one or more of the lines on the chart moving in opposition to price. For example, HIRO shows traders begin buying puts and/or selling calls as price continues to move up. In this case, I would look for a trend reversal and a short entry. Third, trend termination – similar to a trend reversal, one or more of the lines on the chart begin to move in opposition to price and price stalls. For example, if I was long a stock and HIRO shows traders starting to buy puts and/or sell calls, and price stalls or begins to move lower, I would exit the position. The trade examples below illustrate all three of these scenarios.
Trade Example #1: NVDA Trend Continuation, March 18, 2022
After the RTH open on March 18, I sorted my watchlist in SpotGamma HIRO by the highest HIRO Indicator value. SpotGamma HIRO showed the highest values for TSLA and NVDA, just behind SPX. In both cases, the HIRO Signal was at the high end of its recent 5-day and 30-day ranges, as shown in the image below.
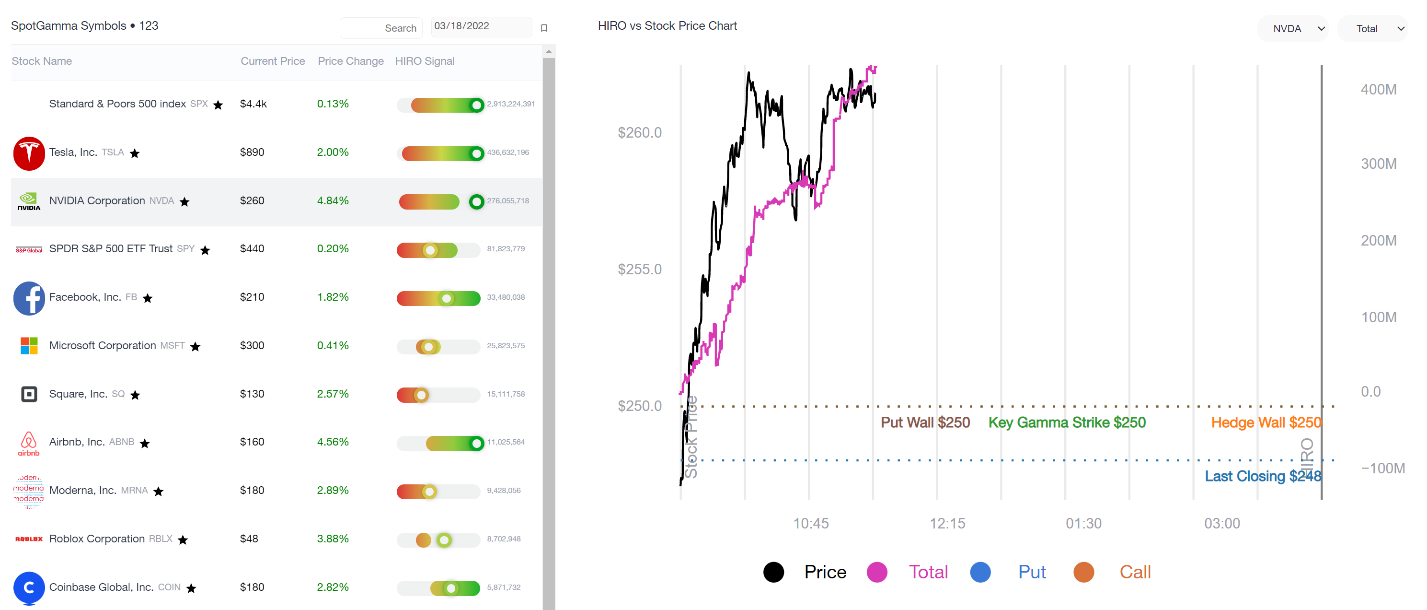
I decided to look at NVDA and changed the chart view to show puts and calls for greater insight into the options trading activity driving the stock higher. Traders were both buying calls and selling puts, fueling the sharp rally higher, as shown in the image below.

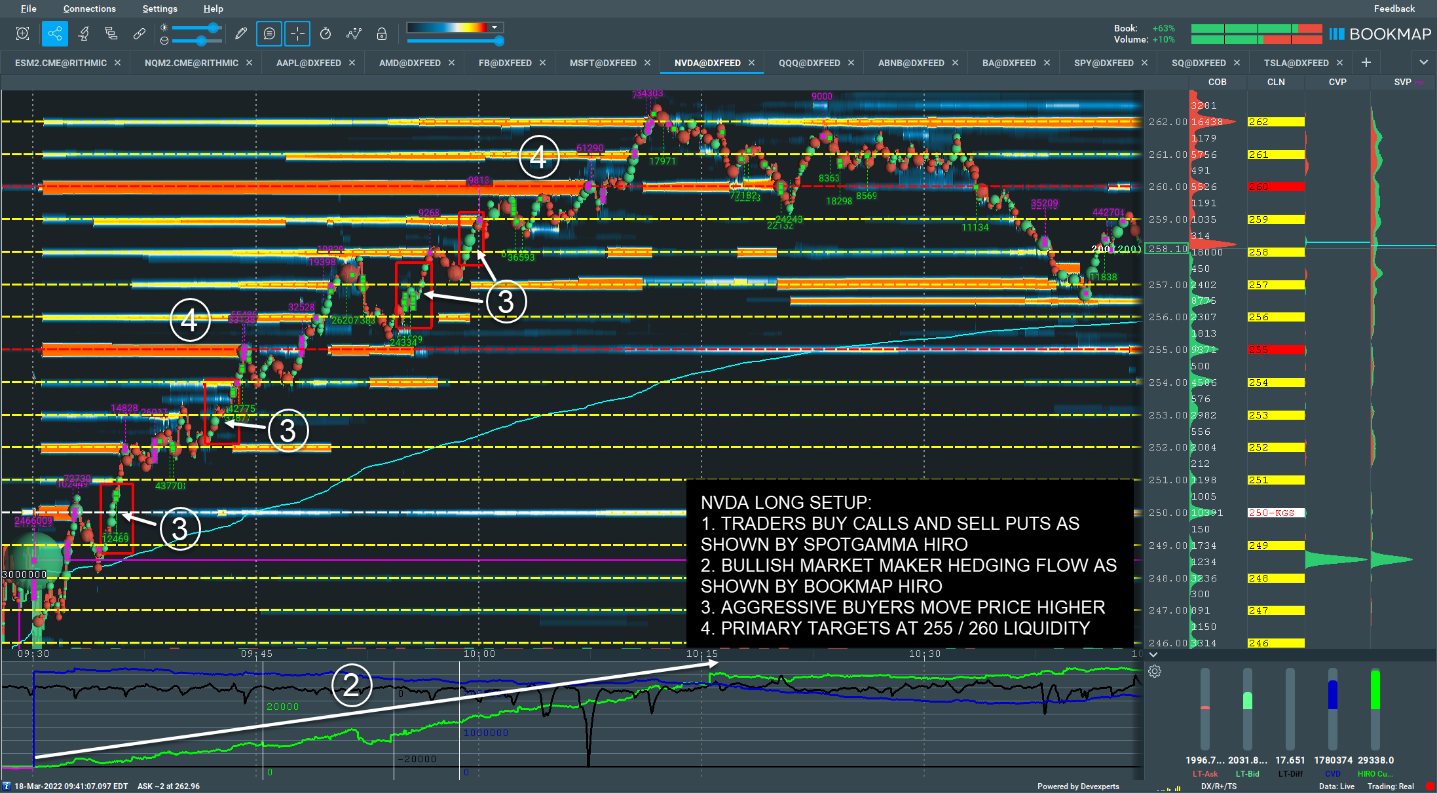
The Bookmap chart below confirms that Market Makers were buying stock to hedge their delta exposure as shown by the rising Bookmap HIRO Indicator (green line) in the sub-chart. There were several opportunities to enter the uptrend that began at the open and continued until traders slowed their call buying around 10:15 AM ET as price reached the high liquidity at 260 – 262.
Trade Example #2: AMD Trend Reversal, March 17, 2022
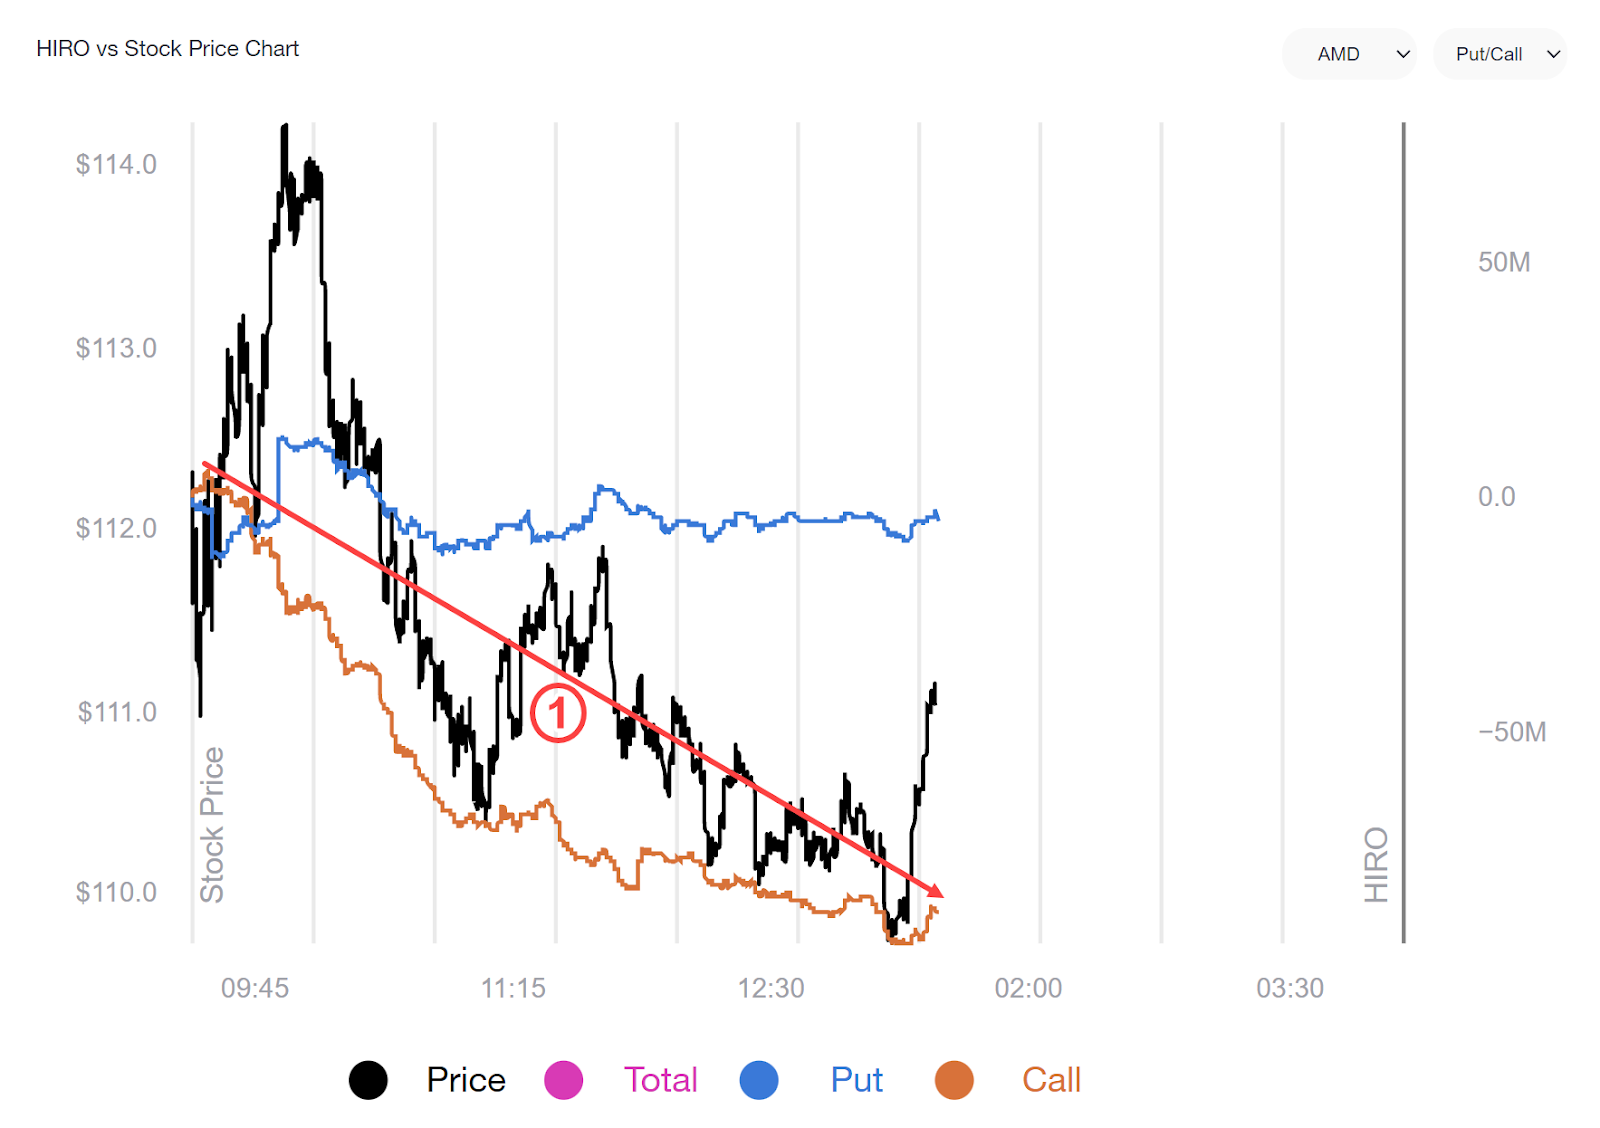
After the open on March 17, I scanned my watchlist and noticed the weak HIRO Signal for AMD. The HIRO Signal was at the low end of its recent 5-day and 30-day ranges. In addition, the Total Aggregate HIRO Reading was moving lower, even as price was moving higher, as shown in the image below.

I decided to look at AMD closer and changed the chart view to show puts and calls for greater insight. The image below shows that traders were primarily selling calls as price moved higher to 114. This divergence in HIRO and price indicated a potential trend reversal and short setup.
I switched over to Bookmap to look for a setup. The chart below shows that sellers absorbed buyers at 114 and price began to move lower. At the same time, Market Makers began to sell stock to hedge their delta exposure as shown by the falling Bookmap HIRO Indicator (green line) in the sub-chart. There were several opportunities to enter the move lower as price headed toward the high liquidity at 110.

Trade Example #3: TSLA Trend Termination, March 15, 2022
After the RTH open on March 15, I sorted my watchlist in SpotGamma HIRO by the highest HIRO Indicator value. SpotGamma HIRO showed the highest values for AMZN, TSLA, NVDA, and AAPL. The HIRO Signal was at the high end of its recent 5-day and 30-day ranges for all these stocks, as shown in the image below.
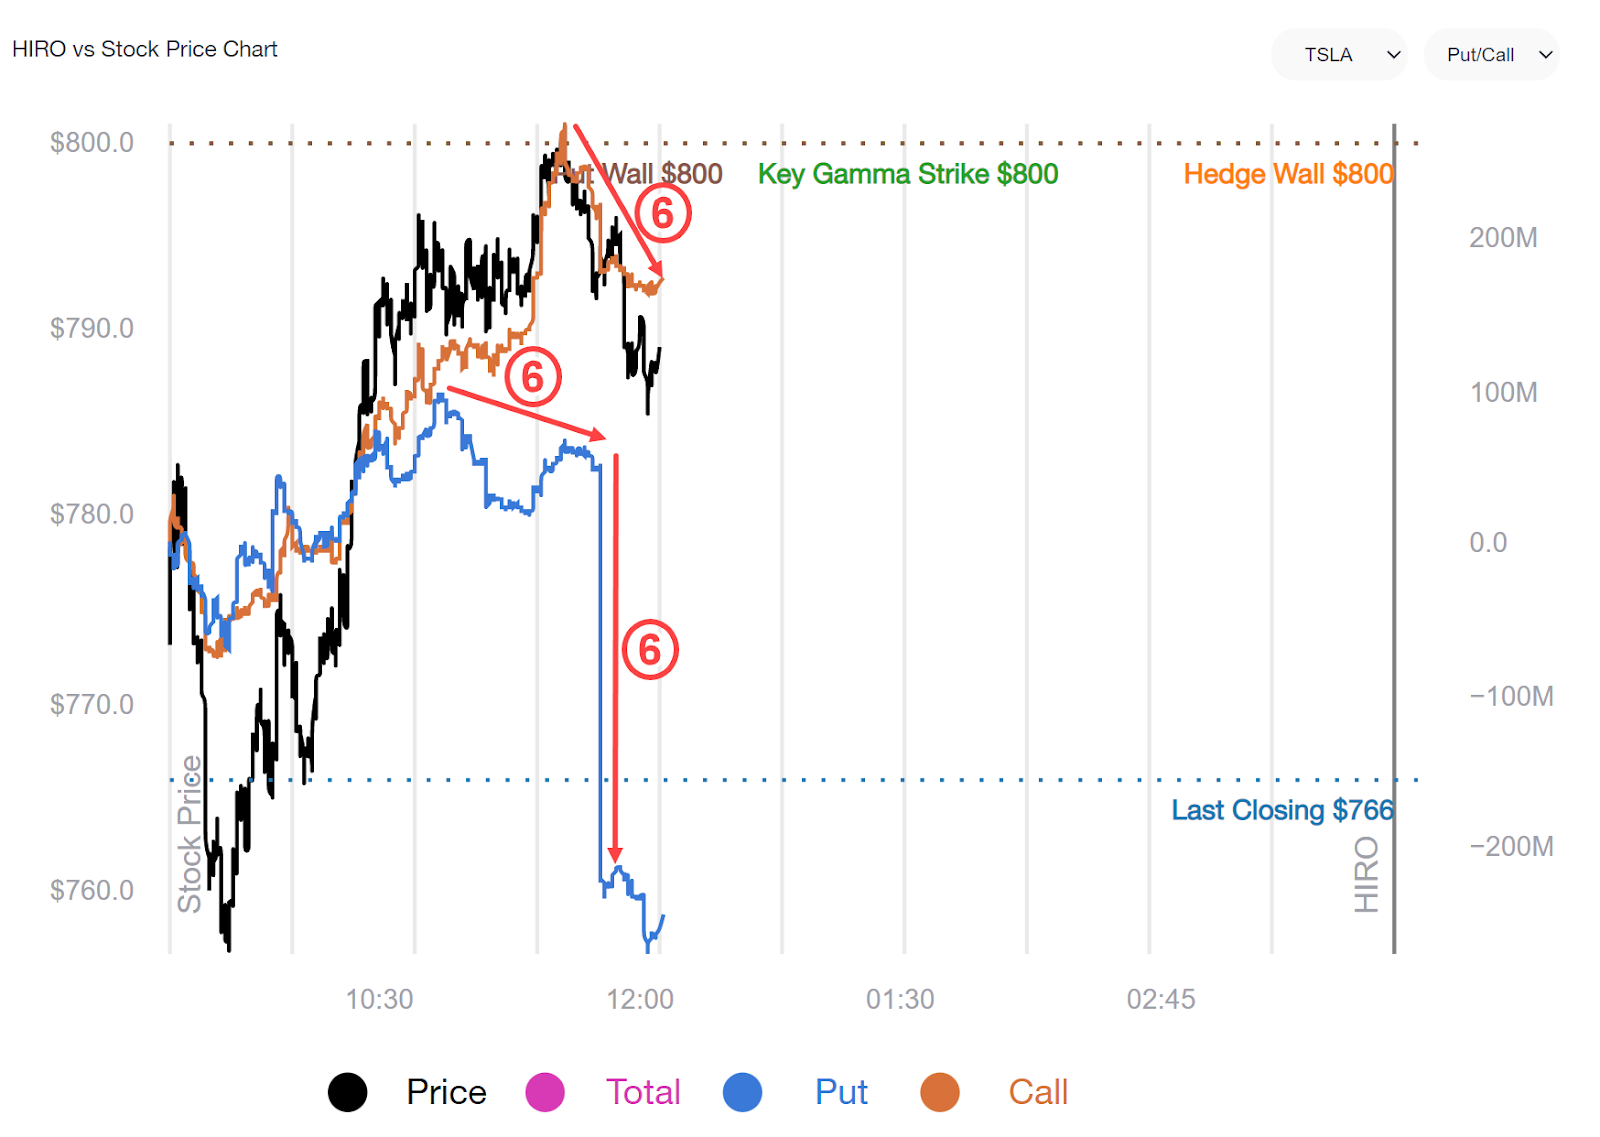
I decided to look at TSLA. As the chart below shows, there is typically a direct correlation between options trades, market maker hedging activity, and price action in TSLA. Price immediately moved higher and traders entered bullish options trades soon after the open.

I switched over to Bookmap to look for a setup. The chart below shows that buyers absorbed sellers at about 760 just after 9:45 AM ET, Market Maker hedging flow (green line in sub-chart) and order flow shifted bullish, and price moved higher. There were several opportunities to enter the move higher as price headed toward the high liquidity at the 800 Key Gamma Strike.

The SpotGamma HIRO chart below reveals that traders stopped selling puts and began buying puts as TSLA approached 800. A large trader also entered a significant put buy order just after TSLA reached 800. In addition, traders immediately started selling calls when TSLA hit 800. The bearish put trades were an early warning to consider exiting a long position. The final sharp move higher in the call line and then the reversal lower at 800 was the final sign to exit longs.
For further definitions and information on the terms used in this article, please see the SpotGamma Support Center for a list of dozens of SpotGamma proprietary terms, as well as context for common market terminology.
SpotGamma Products Used:
- SpotGamma HIRO Indicator, exclusively available via SpotGamma Alpha
- HIRO Indicator (available on Bookmap)