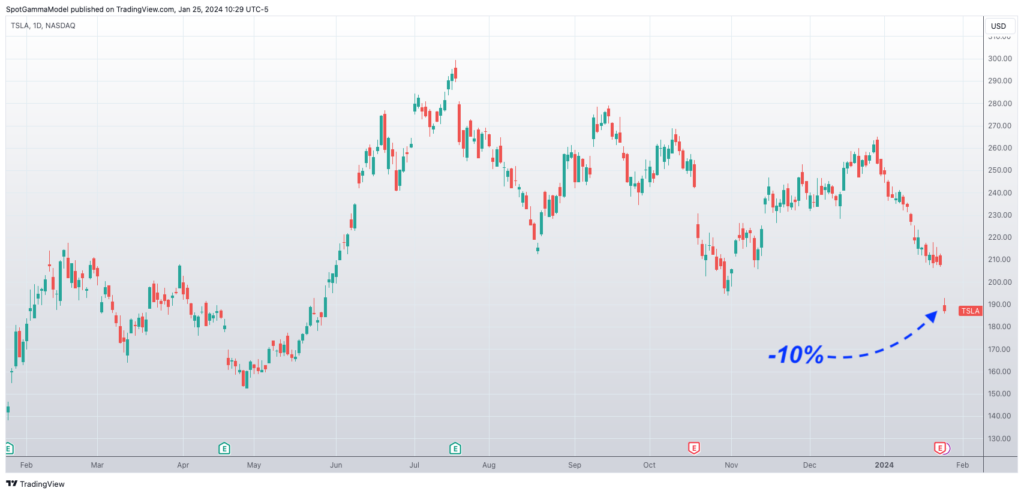
TSLA is down 10% after earnings, and our data is suggesting that if anything, TSLA options are now cheap!

One would think that may lead to an increase in options implied volatility, as the implied move was just 6%. You can see this in the legend in our earnings dashboard, below. This shows us the earnings implied move based on pre-earnings options prices.

Based on fixed strike volatility, we see vols are down across the board. Here we show the change in implied volatility for each strike (x axis) across each expiration (y axis). The shade of red tells us that IV is down across the board.
This generally makes sense given earnings is out of the way, but it is a bid odd given TSLA’s stock is moving past its estimated earnings move.

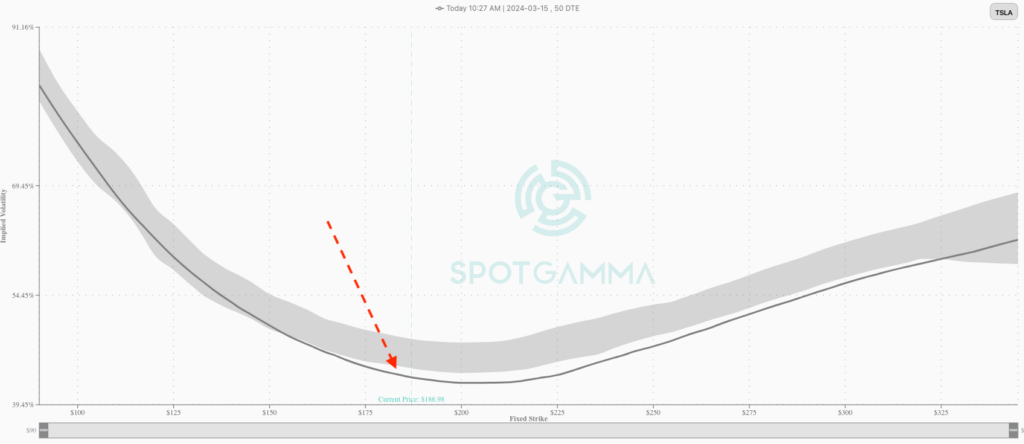
When we zoom in on a specific expiration, like with March skew below, we can see that current IV readings (gray lines) are below were volatility has been over the last 60 days (gray shaded area).
This informs us that options may be less expensive now than than have over the last 60 days.

