• Skip to main content
  • Skip to primary sidebar

SpotGamma™

S&P 500 Stock Market Gamma Trading Levels Based on Options Open Interest

  • About
  • Pricing
  • Academy
  • Resources
    • Tool Demos
    • Case Studies
    • Blog
    • Support Center
    • Free Daily Report
    • Free Trading Tools
      • Options Profit Calculator
      • SPX Gamma Exposure
      • Implied Earnings Moves
      • Volatility Ranking
    • Free Training
    • Report Card
  • Login

implied volatility

Sep 15 2026

FOMC Preview: The Hike Is Priced. The Dots Aren’t.

FOMC Preview: The Hike Is Priced. The Dots Aren't.

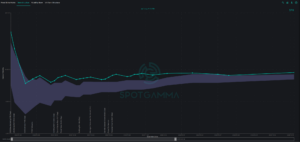
A 25bp hike is overwhelmingly expected on September 16, which makes the dot plot the real surprise vector. A look at what the options market is pricing, where the big volatility hedges are showing up, why September VIX settles before the decision, and why Friday’s expiration may be the bigger structural event.

Written by SpotGamma · Categorized: Market Analysis · Tagged: bonds, FOMC, gamma, implied volatility, interest rates, OPEX, SPX, VIX, volatility

Sep 15 2026

Gamma Guy: S&P 500 Realized Volatility Is the Lowest Since 2020

Gamma Guy: S&P 500 Realized Volatility Is the Lowest Since 2020

Brent Kochuba, founder of SpotGamma, joined tastylive Tuesday to explain why S&P 500 realized volatility sits at 2020 lows ahead of FOMC and a huge OPEX.

Written by SpotGamma · Categorized: Market Analysis · Tagged: 0DTE, FOMC, implied volatility, NDX, negative gamma, OPEX, realized volatility, SPX, tastylive, VIX

Sep 13 2026

Hedging Against a Volatility Spike: VIX Calls vs. SPX Puts

A series of major market catalysts arrive next week: the FOMC rate decision, VIX Expiration, and September Triple Witching OPEX. Options positioning suggests that institutions are already paying up for event protection. Over the past two weeks, we have observed notable VIX hedging activity in our daily FlowPatrol reports. This included several particularly significant positions: […]

Written by Sherry An · Categorized: Market Analysis, SpotGamma Weekly · Tagged: dealer gamma, Gamma Exposure, implied volatility, Options Calculator, options positioning, options skew, spotgamma weekly, SPX puts, theta decay, Triple Witching OPEX, VIX calls, Volatility Skew

Sep 12 2026

September OPEX Options Positioning: Why 7,600 Is the Line | The OPEX Effect

September OPEX Options Positioning: Why 7,600 Is the Line | The OPEX Effect

Brent Kochuba of SpotGamma joined Excess Returns Thursday on September OPEX options positioning, the 7,600 gamma line, oil-rate risk and cheap tech vol.

Written by SpotGamma · Categorized: Market Analysis · Tagged: correlation, dealer hedging, Excess Returns, implied volatility, negative gamma, OPEX, SMH, SPX, The OPEX Effect

Sep 10 2026

S&P 500 Negative Gamma Below 7,600 — Brent Kochuba on tastylive

S&P 500 Negative Gamma Below 7,600 Meets Vol With Room to Lift

Brent Kochuba, founder of SpotGamma, joined tastylive Thursday to map S&P 500 negative gamma below 7,600, a lifting vol surface and Oracle’s call skew.

Written by SpotGamma · Categorized: Market Analysis · Tagged: 0DTE, dealer hedging, earnings, implied volatility, IWM, negative gamma, ORCL, SPX, tastylive

Sep 09 2026

Gamma Guy with tastylive: Options Positioning Pins the Index While Tech Names Make Moves

Gamma Guy: September OPEX Positioning Pins the Index While Tech Moves

Brent Kochuba, founder of SpotGamma, broke down September OPEX positioning, 0DTE flows and cheap IWM hedges on tastylive Tuesday, September 8.

Written by SpotGamma · Categorized: Market Analysis · Tagged: 0DTE, AAPL, dealer gamma, dispersion, implied volatility, IWM, OPEX, SPX, tastylive

Sep 07 2026

AI Infrastructure Runs Hot into September

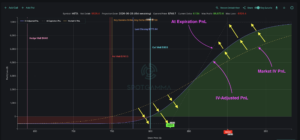
Two profit/loss charts for MU stock showing break-even points around $1,000 strike with expiration on 2026-09-29.

August closed with robust corporate earnings, and nowhere was that clearer than in the AI trade stocks. Last week’s standout report came from Dell (DELL), which jumped 16% after beating estimates and raising guidance. Dell is a leading server provider for AI data center infrastructure. Its results echoed what Nvidia (NVDA) showed a week earlier: […]

Written by Sherry An · Categorized: Market Analysis, SpotGamma Weekly · Tagged: AI data center stocks, bull call spread, call skew, dealer gamma, DELL earnings, Gamma Exposure, implied volatility, Options Calculator, options positioning, options skew, semiconductor rotation, spotgamma weekly, theta decay

Sep 03 2026

Doves Fly into August Jobs Report

August Jobs Report Preview As Doves Fly

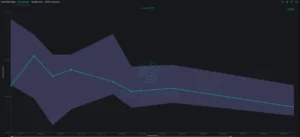
Friday’s 8:30 a.m. ET Employment Situation report has the potential to be the biggest bond-market catalyst since Jackson Hole, yet the options market is pricing a contained move. A look at SPX term structure, fixed strike vol, and dealer gamma ahead of the print.

Written by SpotGamma · Categorized: Market Analysis · Tagged: gamma, GLD, implied volatility, interest rates, jobs report, negative gamma, OPEX, payrolls, term structure

Sep 03 2026

AI Stock Options Reset From a Record Peak: Brent Kochuba on tastylive

AI Stock Options Reset From a Record Peak: Brent Kochuba on tastylive

Brent Kochuba on tastylive: AI stock options have reset from record dispersion, and the positioning no longer rewards shorting tech.

Written by SpotGamma · Categorized: Market Analysis · Tagged: AI stocks, Brent Kochuba, call skew, crude oil, dispersion, implied volatility, semiconductors, tastylive, TSLA

Aug 30 2026

Software Earnings Reignite Risk Appetite

SPY options gamma chart showing strike levels 120, 175, and 200 with positive and negative gamma peaks.

Market sentiment was mixed last week following NVDA earnings and Jackson Hole. While NVDA’s solid outlook pushed the market to within inches of all-time highs, Warsh’s hawkish tone seemed to increase the probability of a September rate hike. Throughout August, the S&P 500 has closed in a narrow 2.6% band (SPX 7,600 – 7,800). The […]

Written by Sherry An · Categorized: Market Analysis, SpotGamma Weekly · Tagged: contango, CRM earnings, dealer gamma, forward implied volatility, Gamma Exposure, implied volatility, options positioning, options skew, ORCL options, semiconductor rotation, spotgamma weekly, SPX term structure, synthetic gamma

  • Go to page 1
  • Go to page 2
  • Go to page 3
  • Go to page 4
  • Go to Next Page »

Primary Sidebar

SpotGamma-Subscriber-Signup-Banner

  • FOMC Preview: The Hike Is Priced. The Dots Aren’t.
  • Gamma Guy: S&P 500 Realized Volatility Is the Lowest Since 2020
  • UBER Insider Buying: A $10 Million Vote of Confidence
  • Hedging Against a Volatility Spike: VIX Calls vs. SPX Puts
  • September OPEX Options Positioning: Why 7,600 Is the Line | The OPEX Effect
  • youtube
  • x
  • Privacy Policy
  • Disclaimer
  • Terms & Conditions
  • Support Center
  • Media
  • Contact Us

©2026 TenTen Capital LLC DBA SpotGamma

All SpotGamma materials, information, and presentations are for educational purposes only and should not be considered specific investment advice nor recommendations. Futures, foreign currency and options trading contains substantial risk and is not for every investor. An investor could potentially lose all or more than the initial investment. Risk capital is money that can be lost without jeopardizing one's financial security or lifestyle. Only risk capital should be used for trading and only those with sufficient risk capital should consider trading. Past performance is not necessarily indicative of future results. Testimonials appearing on this website may not be representative of other clients or customers and is not a guarantee of future performance or success.

View Full Risk Disclosure