• Skip to main content
  • Skip to primary sidebar

SpotGamma™

S&P 500 Stock Market Gamma Trading Levels Based on Options Open Interest

  • About
  • Pricing
  • Academy
  • Resources
    • Tool Demos
    • Case Studies
    • Blog
    • Support Center
    • Free Daily Report
    • Free Trading Tools
      • Options Profit Calculator
      • SPX Gamma Exposure
      • Implied Earnings Moves
      • Volatility Ranking
    • Free Training
    • Report Card
  • Login

Apr 28 2026

Vanna and Charm Explained: The Hidden Greeks Driving Market Rallies

Quick Answer: Vanna and Charm are second-order options Greeks that measure how an option’s delta changes relative to volatility (Vanna) and time (Charm). In the S&P 500, these forces drive market maker hedging flows, often fueling “volatility-reset” rallies as Vanna flows force dealers to buy futures when IV drops.

Moving Beyond Gamma: The Power of Vanna and Charm

While most traders focus exclusively on Gamma, professional market makers are equally concerned with Vanna and Charm. These two “hidden” Greeks are often the primary drivers of the slow, grinding rallies and end-of-day pins seen in the S&P 500.

What is Vanna? (The Volatility-Delta Bridge)

Vanna measures the rate at which an option’s Delta changes as Implied Volatility (IV) changes. For options dealers, Vanna exposure is a major source of risk.

When the market is in a “Short Vanna” regime, a drop in volatility forces market makers to buy futures to remain delta-neutral. This is the mechanical engine behind the “volatility-reset rally”—as fear subsides and IV drops, dealers are forced to buy, pushing price higher, which further drops IV, creating a self-fulfilling loop of buying pressure.

What is Charm? (The Time-Delta Bridge)

Charm (also known as Delta Decay) measures the rate at which an option’s Delta changes as time passes toward expiration. This is particularly impactful in the 0DTE era.

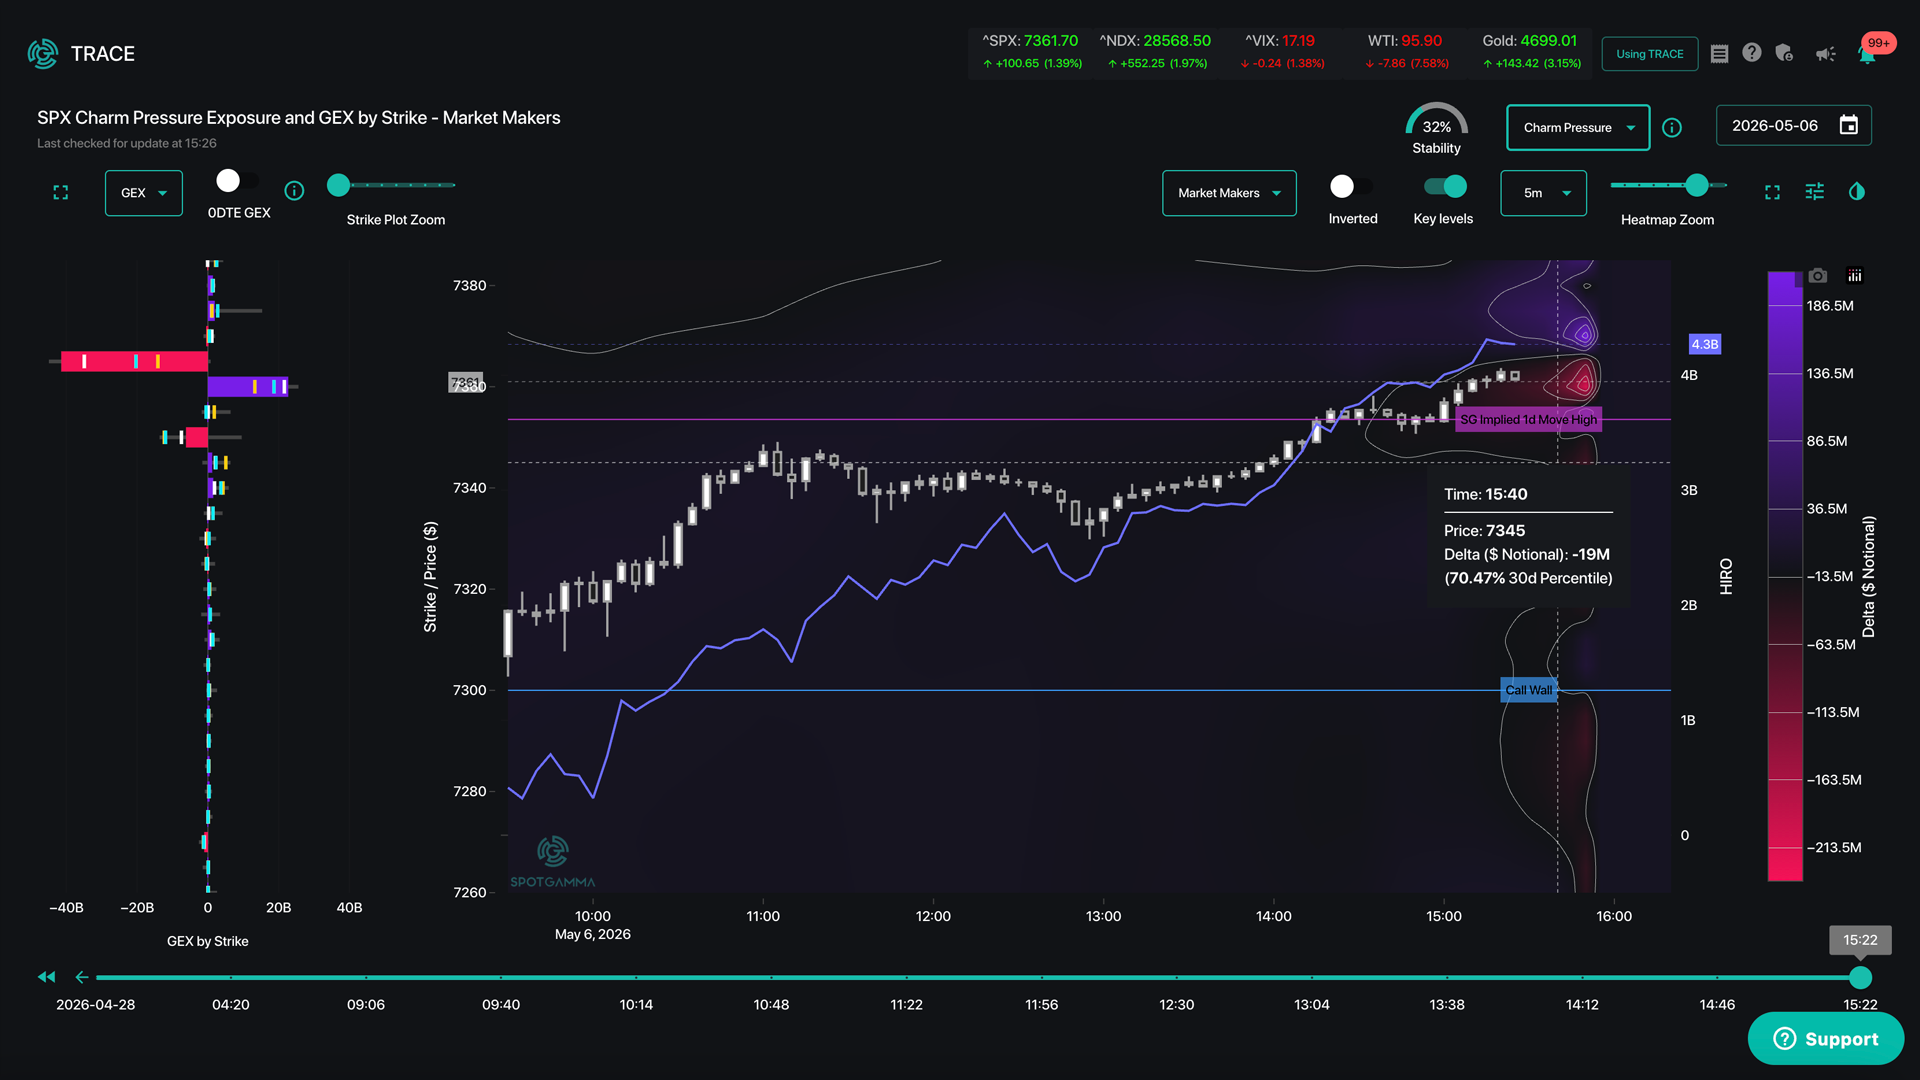
As options approach expiration, their Delta values naturally decay toward either 0 or 100. Market makers must adjust their hedges accordingly. Charm Pressure is often the force that leads to the “End of Day Pin,” where the market gravitates toward a specific strike price as dealers bleed off delta exposure into the 4:00 PM close.

Tracking Vanna and Charm with SpotGamma TRACE

SpotGamma TRACE provides a dedicated Charm Pressure lens to help traders visualize this time-based hedging flow. By identifying zones of intense Charm activity, you can anticipate where the market is likely to stall or accelerate as the trading day nears its conclusion.

Key Vanna/Charm Takeaways:

  • Vanna Rallies: Occur when declining IV forces dealer buying.
  • Charm Pins: Occur when time decay stabilizes dealer hedging at specific strikes.
  • The 0DTE Effect: Charm is most aggressive in the final two hours of the trading session.

Master the Hidden Greeks

Understanding Vanna and Charm is what separates retail traders from institutional professionals. By tracking these flows, you aren’t just watching the market—you’re watching the mechanics that move it.

Ready to see Charm Pressure live? Join SpotGamma Alpha and unlock the TRACE dashboard today.

Share This Article

  • Share
  • Twitter
  • LinkedIn
  • Reddit
  • Facebook

Written by SpotGamma · Categorized: Market Analysis

Don’t have an account with SpotGamma?

Choose the plan you want today to view unique support and resistance levels, access Founder’s Notes and expert commentary, daily trading ranges, and entrance into our private Discord.


Primary Sidebar

Related Resources

  • Options Exchange Monitor — Week of August 15, 2026 (36 SEC notices, 2 CFTC, 0 EDGAR)

    Options Exchange Monitor — Week of August 15, 2026 (36 SEC notices, 2 CFTC, 0 EDGAR)

    August 17, 2026
  • GEX Levels for SPY, QQQ, ES and NQ: Using Index Gamma in Any Product

    GEX Levels for SPY, QQQ, ES and NQ: Using Index Gamma in Any Product

    August 17, 2026
  • How to Trade GEX Levels: A Practical Guide to Gamma-Based Trading

    How to Trade GEX Levels: A Practical Guide to Gamma-Based Trading

    August 17, 2026
  • Free GEX Levels, Charts, and Data: What’s Available and What It’s Actually Worth

    Free GEX Levels, Charts, and Data: What’s Available and What It’s Actually Worth

    August 17, 2026
  • Covered Calls After Assignment: What to Do When the Stock Drops Below Your Cost Basis

    Covered Calls After Assignment: What to Do When the Stock Drops Below Your Cost Basis

    August 17, 2026
  • youtube
  • x
  • Privacy Policy
  • Disclaimer
  • Terms & Conditions
  • Support Center
  • Media
  • Contact Us

©2026 TenTen Capital LLC DBA SpotGamma

All SpotGamma materials, information, and presentations are for educational purposes only and should not be considered specific investment advice nor recommendations. Futures, foreign currency and options trading contains substantial risk and is not for every investor. An investor could potentially lose all or more than the initial investment. Risk capital is money that can be lost without jeopardizing one's financial security or lifestyle. Only risk capital should be used for trading and only those with sufficient risk capital should consider trading. Past performance is not necessarily indicative of future results. Testimonials appearing on this website may not be representative of other clients or customers and is not a guarantee of future performance or success.

View Full Risk Disclosure