Key Takeaways
We believe the options market is signaling something much larger than a temporary volatility anomaly. The Nasdaq itself has structurally changed in the past year, with its year-to-date performance +16% vs +9% for the S&P500. Concentration, AI exposure, new index methodology, and options positioning have transformed it into a meaningfully different investment than the S&P 500.
Three forces are converging. First, the AI trade has created an unusually concentrated group of stocks that increasingly move as a single macro factor rather than independent companies. Second, that concentration has pushed Nasdaq correlation materially above the S&P 500. Third, Nasdaq’s new fast-entry methodology—beginning with the addition of SpaceX today—will likely reinforce this trend by introducing younger, higher-volatility companies into the index much earlier than before. The options market appears to be recognizing this structural shift before most investors.
- VXN-VIX spread is at extreme levels: Currently +11.8 (90th percentile since 2001). Nasdaq-100 implied volatility is pricing in significantly more movement than the S&P 500, the widest divergence in over two decades outside of major crises.
- It’s not just individual tech stocks being volatile: The majority of the NDX-SPX vol gap is coming from correlation, not single-stock realized volatility. Nasdaq stocks are increasingly moving together as one macro trade, while the S&P 500 is maintaining its diversification.
- AI concentration is reshaping the Nasdaq: A handful of AI/semiconductor names (NVDA, AVGO, MU, ARM, ASML, etc.) are driving most of the divergence. These stocks react to the same macro drivers, pushing NDX correlation higher while single-stock vols remain elevated.
- Nasdaq changed the rules — and its character: New fast-entry rules for mega-cap IPOs (e.g., SpaceX/SPCX joining July 7) are accelerating the inclusion of younger, higher-growth, higher-volatility companies.
- Options positioning reflects the split; Traders are generally short options in SPX and top single stocks, but long options in Nasdaq. This suggests the market has been betting Nasdaq volatility will rise — a bet that has been working.
- SPY and QQQ are no longer the same trade: For years they moved in lockstep. The options market is now signaling they have meaningfully different risk profiles. Short-term: Nasdaq vol is likely to reprice higher. Long-term: Investors are getting two distinct exposures.
VXN – VIX: The Chart That Made Me Stop
For decades now, most investors have treated SPY and QQQ as essentially the same trade. QQQ simply tracked technology versus a more diversified S&P500 basket. Despite their different holdings, both indices largely moved together, driven by the same mega-cap stocks. First the “FAANGS” and then the “Mag7”, and this drove tight NDX/SPX correlation.
Today, the spread between the Nasdaq Volatility Index (VXN, a.k.a. “Nasdaq VIX”) and S&P500 VIX is sitting at the widest levels of the past 25 years (2nd plot). You must go all the way back to the early 2000’s Internet Bubble to find a wider divergence.
This signal tells us that traders are anticipating significantly higher volatility for the Nasdaq vs the S&P500 in a way that is unparalleled in modern equity markets.
Nasdaq Volatility Index (VXN) vs VIX shows an historic divergence.
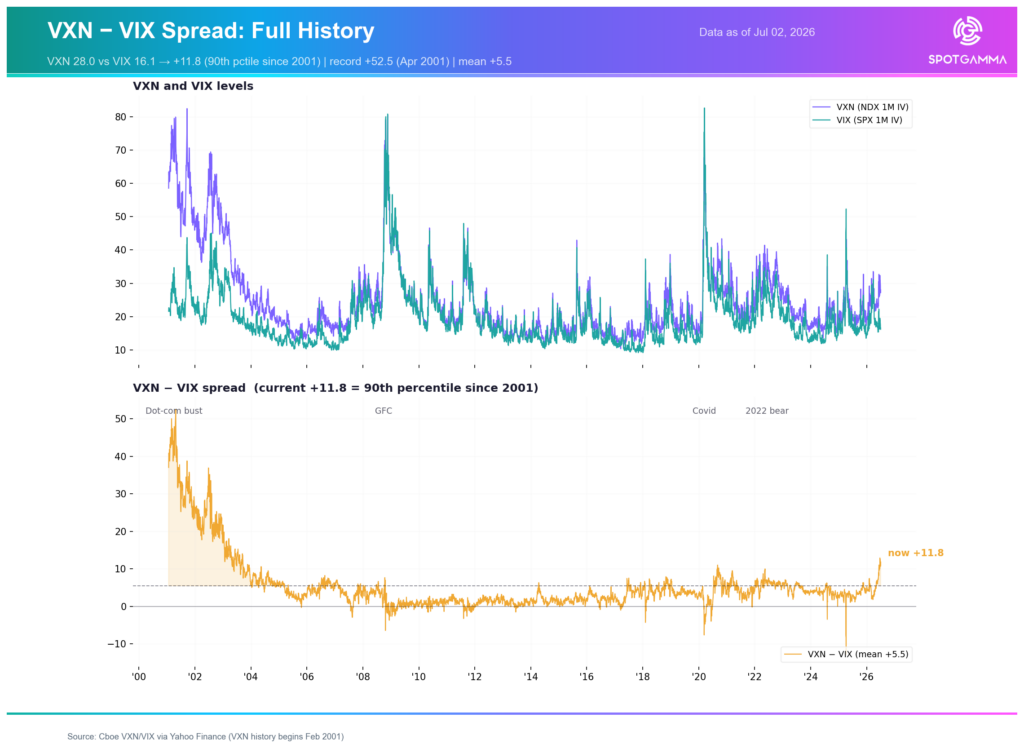
Adding to the intrigue, both indices are just a few percent from all-time highs. Typically, all-time price highs are associated with lower index volatility.
It’s clear the volatility market is now saying something is very different about these indices, which raises a simple question: What changed?
It Isn’t Just Tech Stocks Being More Volatile
The obvious explanation is that technology stocks have become more volatile. That’s true, but it isn’t the full story. Realized volatility (RV, how fast index prices have moved over a given time period) in both the Nasdaq & S&P500 has been extremely elevated as stocks jettisoned toward record highs in June: NDX and SPX posting +35% and +19% gains, respectively, from March lows to June highs.
From March stock lows, traders were pricing in a lot of stock movement – that is to say implied, or future volatility (IV) had anticipated larger price movement versus what had been occurring. This state, where IV > RV, is typical of volatility markets as “what has been happening” is the best barometer for “what is likely to happen going forward”. That RV base case, plus some risk premium, generally marks IV a bit higher than RV.
However, in Mid-May a divergence started to appear. Nasdaq realized volatility has consistently exceeded what options were pricing (bottom chart). This dynamic only briefly occurred in the S&P500, and this NDX volatility anomaly has only surged since.
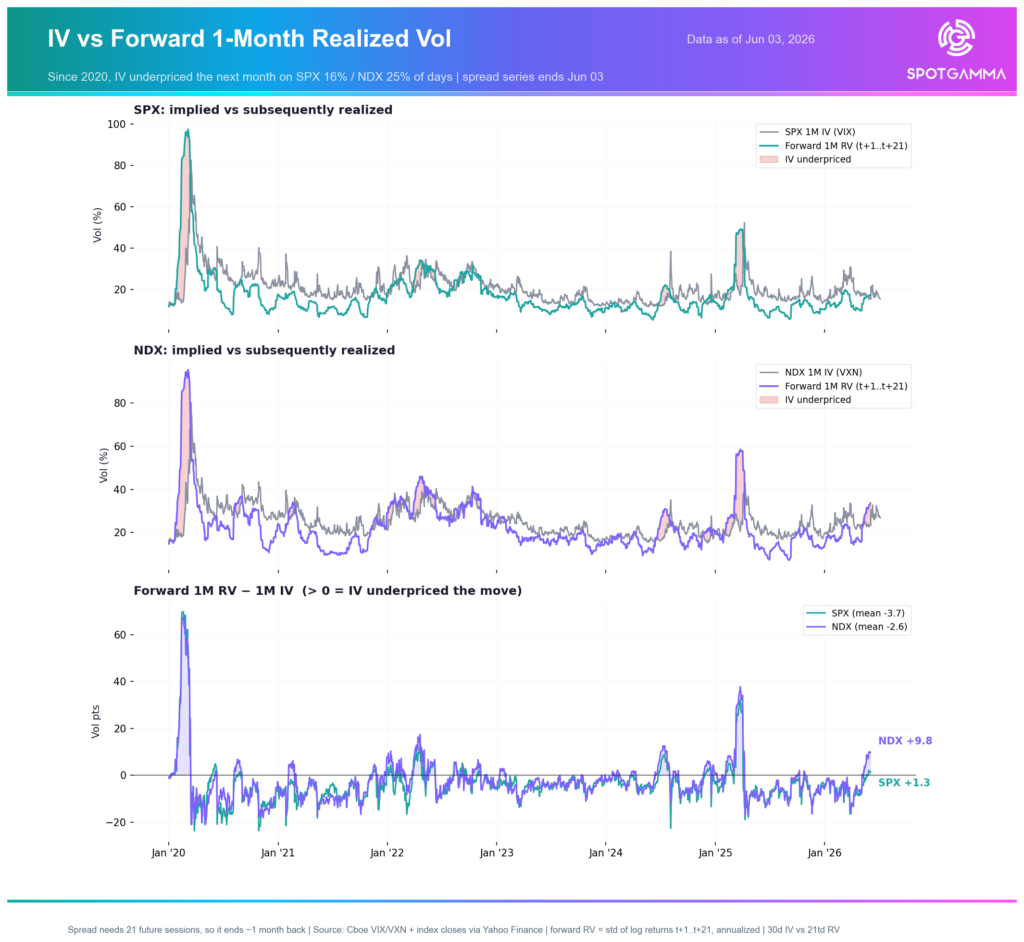
NDX vs SPX implied and forward realized volatility shows that traders are underpricing NDX volatility in a way they are not in SPX.
Below (left) you can see the difference between the current extreme level of the Nasdaq VIX Index (VXN) and forward 1-month realized volatility. The current divergence is more than -10, which is unprecedented during times of market strength.
In other similar periods this relationship has been low because of sharp, unexpected crashes like Covid and April 2024 tariffs.
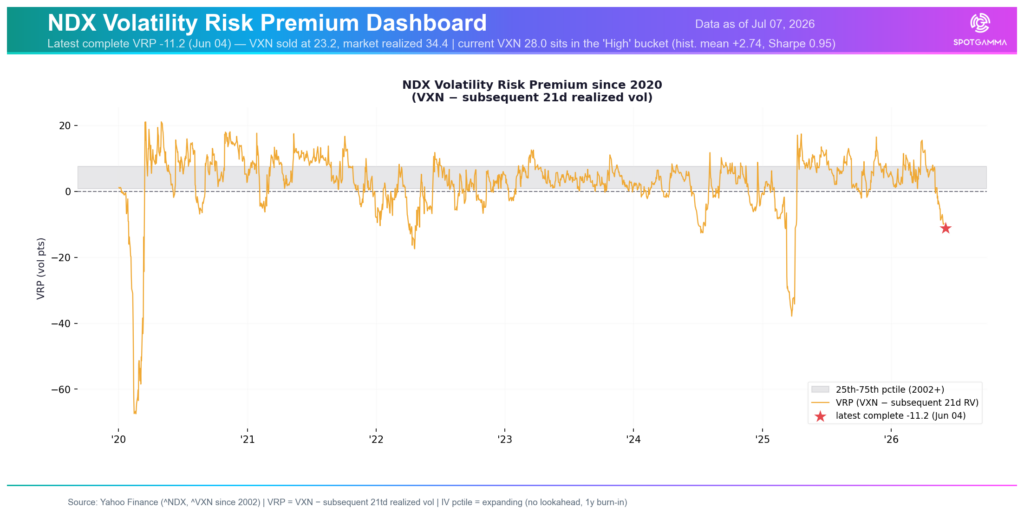
Nasdaq implied volatility (1-month ATM) is serially underpricing forward realized volatility (1-month). This is unprecedented during eras of positive NDX returns – save for the 2000s internet bubble.
Compare that to the S&P500, which still shows a volatility underpricing of roughly one volatility point. This is still unusual during equity strength, but divergence is of much less magnitude.
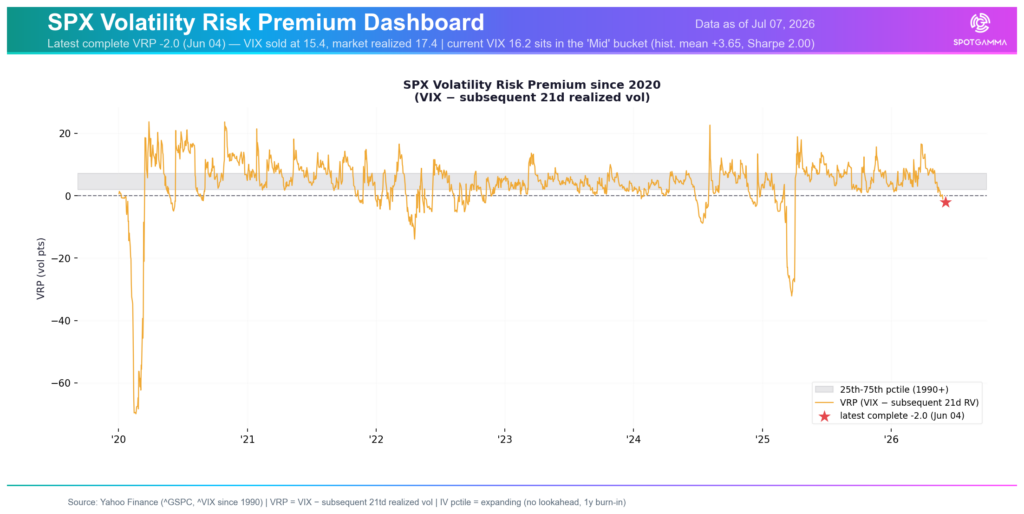
S&P500 implied volatility (1-month ATM) is fairly pricing forward realized volatility (1-month).
It isn’t simply price action that is causing volatility – something else is adding the divergence. Below you can see the Nasdaq (QQQ, blue) has outperformed the S&P500 (SPY, candles) but just 1% over the last month.
QQQ is outperforming SPY by ~1% over the past month.
So, why is the Nasdaq still experiencing so much relative volatility?
Index Correlation & Composition
Equity traders often cite stock correlation as a descriptive function of price action. Stocks are either moving in conjunction with each other (high correlation), or there is a lot of dispersion as traders place different bets on unique sectors and themes. Generally high correlation occurs during risk-off periods, when traders sell all stocks in favor of safe-haven assets like cash, bonds, etc.
When options traders discuss correlation, it is often related to the correlation of option implied volatility levels across stocks. During times of fear, implied volatility levels surge for both single stock and index options, creating high volatility correlation.
What historically drives extreme lows in options-based correlation is when highs in single stock options are marked against relative lows in index volatility. Correlation lows typically occur when traders buy call options in top stocks, like the Mag-7 and/or “AI” names, and fund those calls by selling SPX index calls.
The third panel of the graphic below shows correlation measurements for the SPX (teal) and NDX (purple). You can see that these two plots tend to test the lower bound at relatively similar times, typically during relative market highs. However, things are different now.
Nasdaq realized correlation is far exceeding the S&P500.
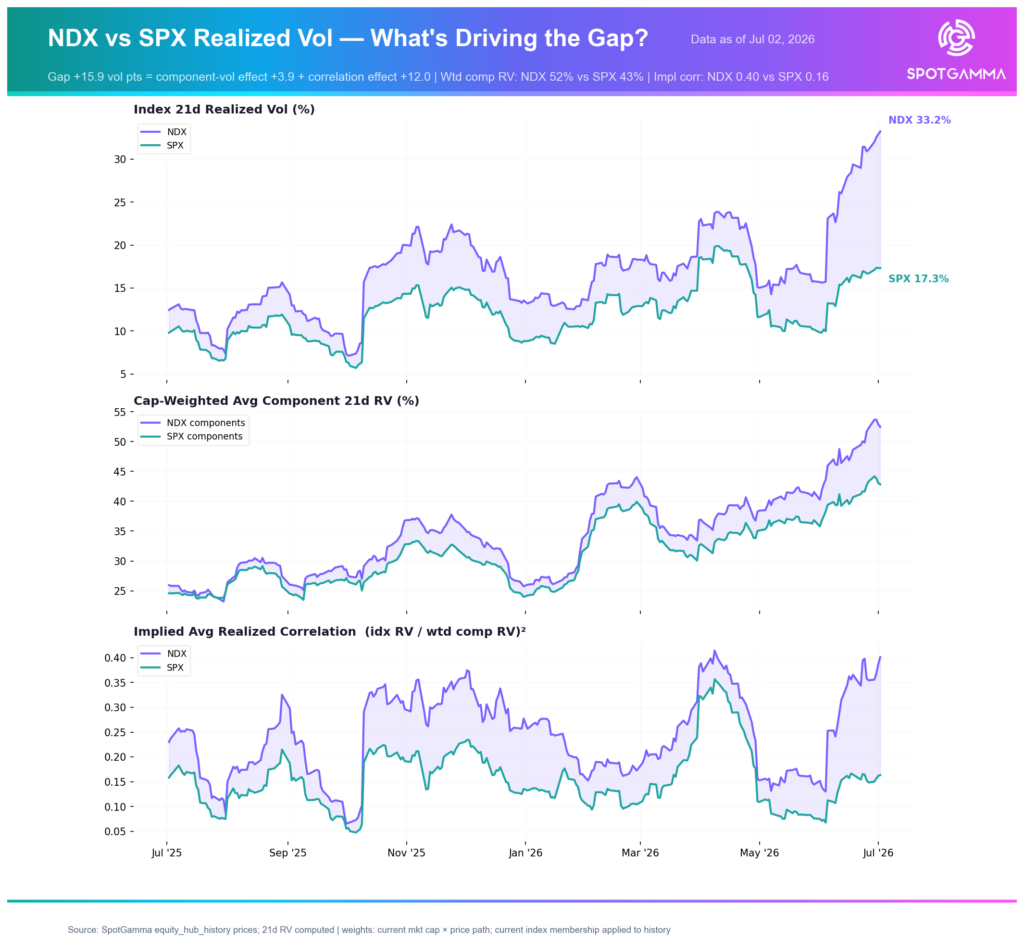
NDX correlation is materially higher than SPX – a signal that the NDX implied vol is at similar highs to its single stock components.
NDX correlation is materially higher than SPX correlation—a sign that Nasdaq implied volatility is increasingly behaving like the implied volatility of its largest constituent stocks.
What’s driving that divergence? Surprisingly, only a small portion of the volatility gap comes from individual stocks becoming more volatile. The majority of the gap comes from correlation.
Put another way, Nasdaq stocks are increasingly moving together. Instead of acting like a collection of individual companies, they are trading as one macro theme—largely driven by AI expectations. The S&P 500 remains different. Its sectors continue to offset one another, allowing weakness in one area to be balanced by strength in another.
We typically think of the S&P 500 as a diversified equity index. Today, it’s also functioning as a diversified volatility index. The Nasdaq, by contrast, is increasingly behaving like a single macro trade.
AI Has Changed the Character of the Nasdaq
The table below shows which stocks are contributing the most to the volatility gap: Nvidia (NVDA), Broadcom (AVGO), ARM, ASML, Micron (MU), Marvell (MRVL) and others.
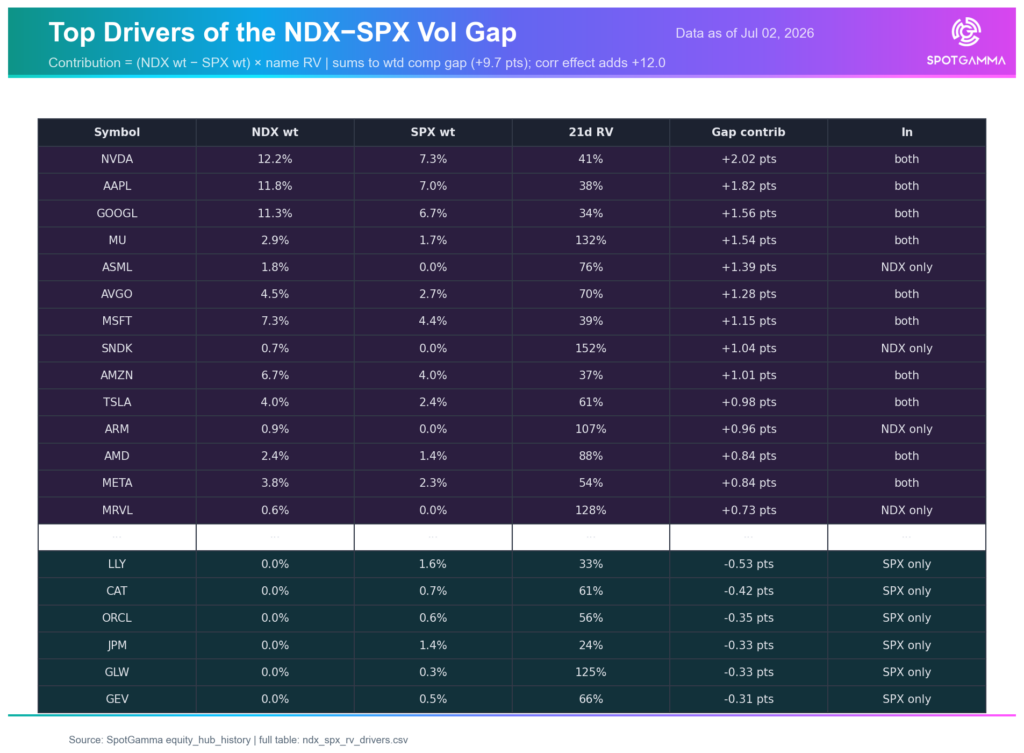
Top drivers of the NDX/SPX volatility gap
While both indexes hold the core “Mag 7” names, it’s the other top tier constituents which are driving the massive volatility divergences: AI vs everything else. You can see some of the divergent volatility levels for top tech names, like MU (top, red) vs more sanguine non-tech names held exclusively in the S&P like JPM, V, etc. (middle plot).
1-month ATM IV for top stocks in the Nasdaq & S&P500.
These top tech companies don’t just have high volatility—they tend to react to the same sector drivers. Further, this AI-tech sector has become the leading macro driver. When AI spending expectations change, much of the Nasdaq index moves together vs only a portion of the S&P. That’s why correlation has become such a powerful force.
As this select group of stocks have rallied sharply, their market caps have surged, increasing their weights in the respective indexes. This has led to a “super concentration” of constituents in the Nasdaq with 49% of the NDX weight concentrated in the top 10 names. This, vs 39% for the S&P500.
Weightings of top components in the Nasdaq 100 vs S&P500
The Nasdaq Changed Its Philosophy – and the Rules
For years, SPY and QQQ mostly differed somewhat marginally across sector exposure. The Mag7 names dominated both indexes. Now, an argument can be made that they differ by philosophy, at a time when GDP is becoming more tech-driven.
In early 2026 (effective around May 1), Nasdaq revised its Nasdaq-100 index methodology specifically to accommodate massive new IPOs like SpaceX (SPCX). Key changes include:
· Shortened “seasoning” period: Newly public companies with enormous market caps (ranking in the top ~40 of the Nasdaq-100 by market cap) can join the index after just 15 trading days post-IPO, instead of the previous minimum of ~3 months (or up to a year in some cases).
· Targeted at mega-IPOs: This “fast entry” rule applies to companies that would immediately rank among the largest in the index. SPCX easily qualified at its ~$1.75T+ valuation.
· Float/weighting adjustments: Nasdaq also tweaked how it handles low public float (common in IPOs with heavy insider/early investor lockups). It applies a multiplier (e.g., treating a small float as larger for weighting purposes, up to certain limits) to give these stocks meaningful index weight without extreme volatility.
This is most pertinent to SPCX, which is included in the Nasdaq 100 on July 7th, but also matters for the potential inclusion of upcoming massive-cap IPOs of Anthropic and Open AI – both of which are expected to IPO in the next year.
These are trillion-dollar entities that could massively shift the risk (and return) profiles of the respective indexes.
Nasdaq wants transformational companies in the benchmark as quickly as possible. The S&P continues to emphasize seasoning, profitability and stability. The allocations in the Nasdaq have been driving massive outperformance for decades, and new decisions around index methodology could continue to shift risk profiles.
The table below shows which Nasdaq names have the highest IV. With SPCX inclusion on July 7th, it is set be the 18th highest IV stock with an ATM IV of 79% vs a Nasdaq-constituent mean of 51%. The point here is that SPCX may be an accelerant to Nasdaq volatility – as may future similar additions that are unlikely to be immediately added to the S&P500.
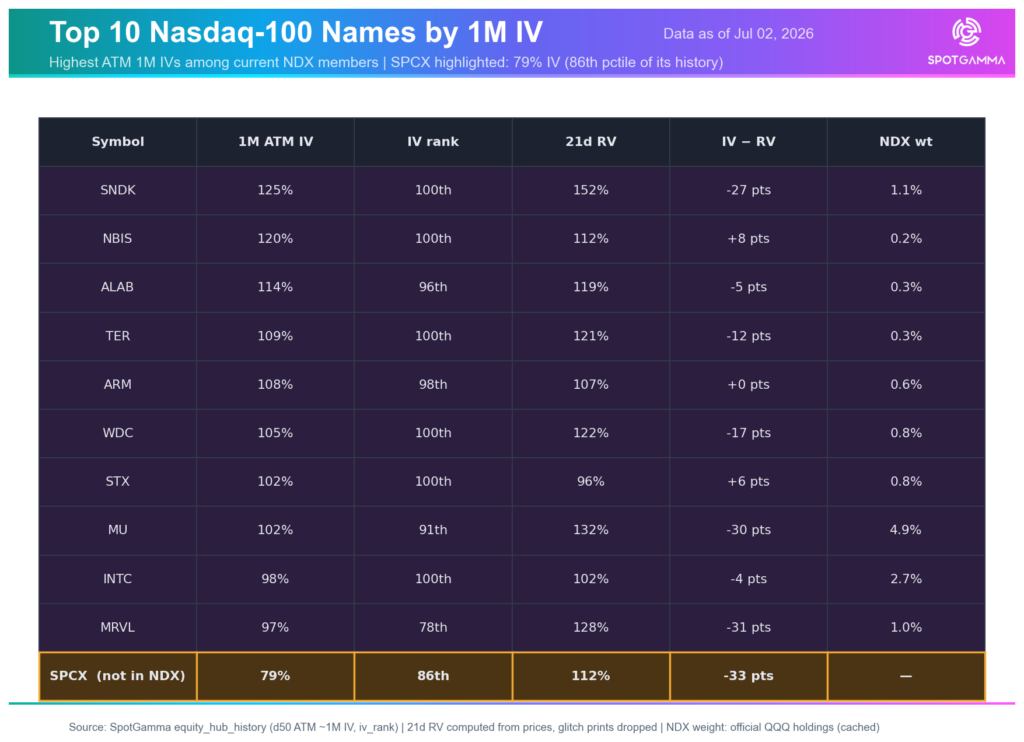
Stocks in the Nasdaq 100 with the highest 1-month ATM IV.
Higher Returns Have Always Come with Higher Volatility
The Nasdaq has outperformed the S&P for decades, and with those larger returns there has been higher volatility.
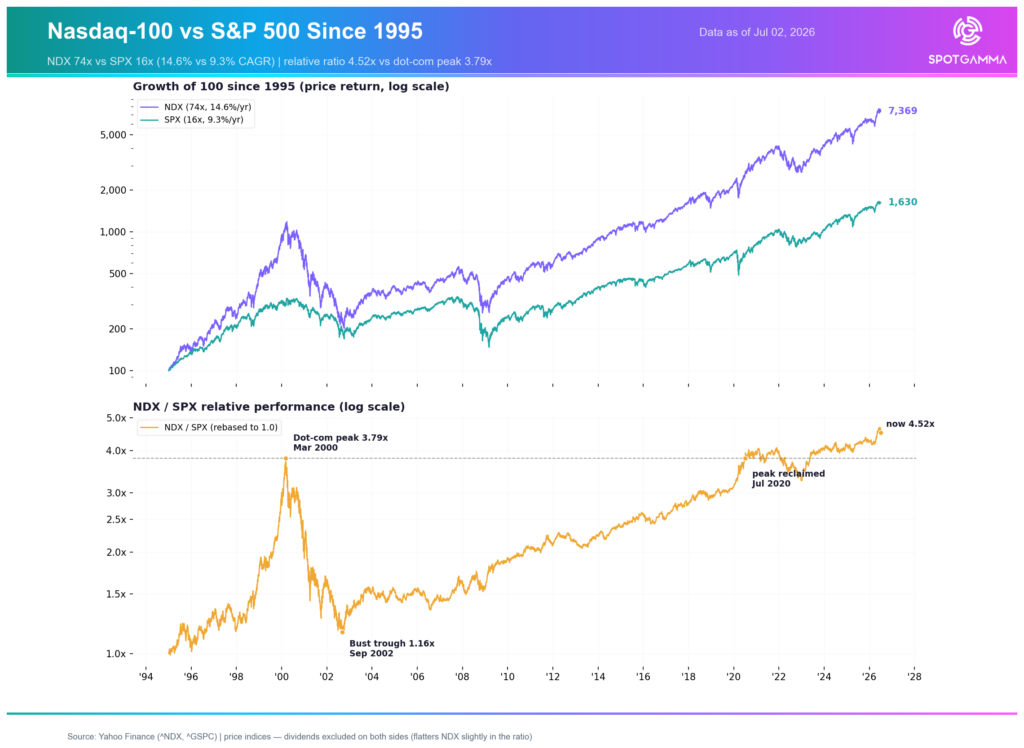
QQQ vs SPY performance
With these new Nasdaq index rules, buying Nasdaq increasingly means buying companies earlier in their life cycle, with the idea that investors are gaining access to tomorrow’s mega-cap companies. That earlier entry is a bet on higher expected growth, but likely comes with higher expected volatility.
How are Options Markets Positioned into the Historic Volatility Divergence?
A quick primer on options: SpotGamma tracks the buyside buying and selling of options contracts. When the buyside trades they generally do so against the dealer community. When the buyside transacts, dealers take the opposite side of the trade. If investors buy options, dealers sell them. If investors sell options, dealers buy them. Gamma is a weighting mechanism for options hedging flow. If dealers are long gamma, it means they are on net owners of options and will hedge in a way that may suppress market volatility. Conversely, if dealers are short gamma, that means they are short options, and hedge in a way that may expand volatility.
Buyside traders in SPX (S&P500 Index) options have been selling near-the-money options, while being long out-of-the-money options (i.e. “the tails”). This means that options dealers have been buying these options, which generates a positive gamma position (blue).
Selling S&P500 (SPX + SPY) options would, in theory, serve to drive S&P500 IV lower, which is a factor in why SPX correlation measurements are at lows.
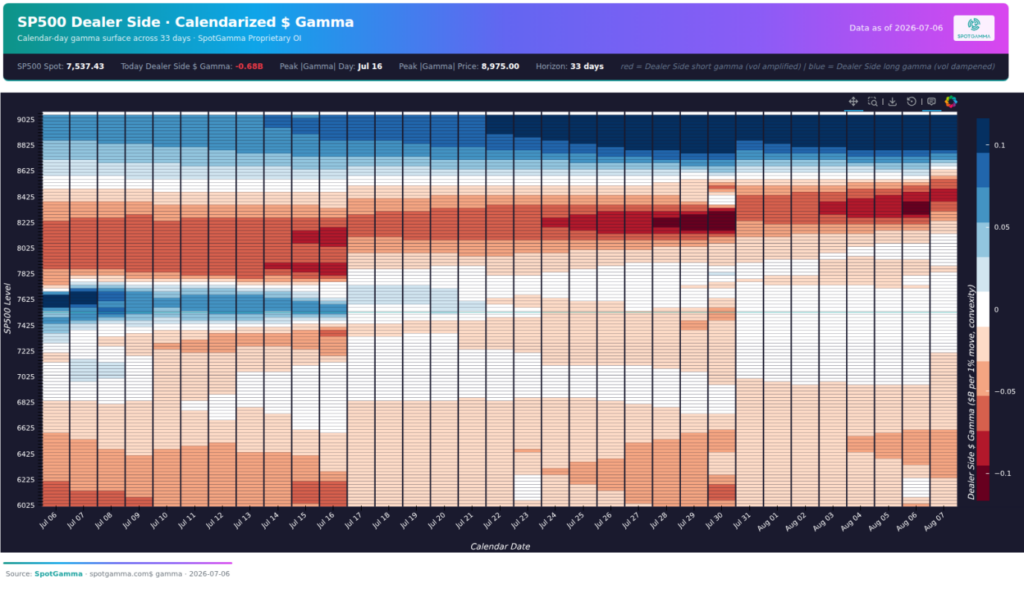
S&P500 (SPX+SPY) Dealer Gamma Map. SpotGamma proprietary data.
Historically, the other factor behind low S&P500 correlation is the buying of single stock options, which tends to get more aggressive as traders bid up call options into upside manias. We have certainly just come from one such manic period, with semi stocks (SMH) rallying +60% over the last 90 days. This sector performance, and volatility, has driven implied vols of top tech stocks, and tech ETFs, to massive highs
This is where positioning gets interesting. Buyside traders have, on net, now been meeting these high implied volatilities by selling single stock options. This is shown in the heatmap below, which aggregates the positioning across the top 100 stocks in the S&P500. This depicts an across-the-board positive gamma position for dealers in the top stocks of the S&P500. This type of positioning makes sense if traders were trying to take advantage of the extremely high single stock vols, making bets that the volatility will subside.
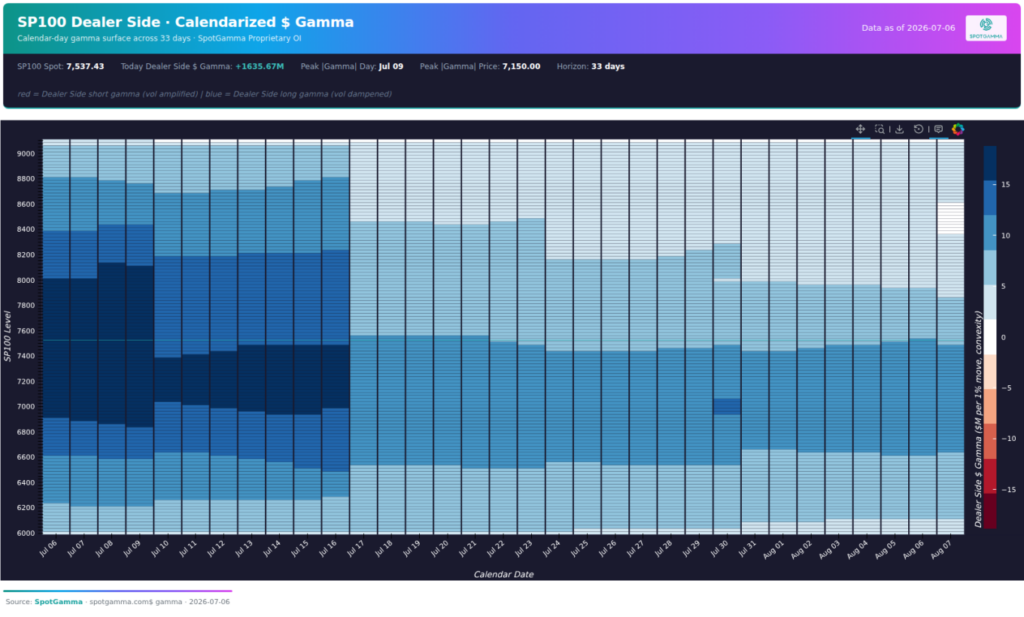
Top 100 stocks in the S&P500 aggregate Dealer Gamma Map. SpotGamma proprietary data.
While we mark positive SPX and single stock gamma from buyside traders selling options, we see traders long Nasdaq (NDX+QQQ) options. This gives dealers the opposite position – short options and short gamma. This is a bet that Nasdaq volatilities are set to increase, a bet that appears to have been paying off over the last 90 days as realized Nasdaq volatility has been exceeding implied volatility.
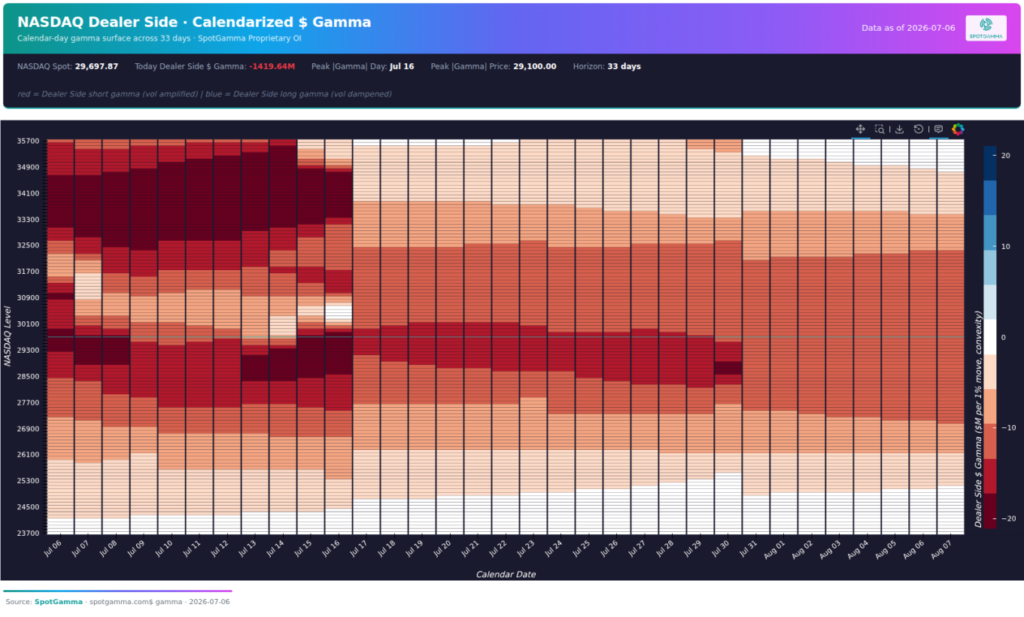
Nasdaq 100 (NDX+QQQ) Dealer Gamma Map. SpotGamma proprietary data.
The takeaway from these positions is that traders are continuing to bet on low S&P500 index volatility, while also betting that single stock implied volatility will decrease. They are offsetting these short positions with long positions in Nasdaq options.
This is an indication that the Nasdaq volatility may remain divergent for the near future, as dealer hedging in the Nasdaq is set to sell into declines and buy into rallies. This, vs the opposite positive gamma positioning in top single stocks/ S&P500, which suggests dealers are buying into weakness, and selling into strength.
Conclusion/What’s the Trade?
For short term traders, the focus here is on the volatility markets. It will be hard for Nasdaq index volatility to remain serially underpriced, as it had been for the last 45 days. Additionally, the record high single stock vols are likely to reduce as many of tech stocks have been priced meaningfully higher. SpotGamma believes that a sharp stock market correction is likely, one which would lead the implied volatility of the Nasdaq options to move above its realized volatility.
Until that re-syncing happens, we think that equity markets will be prone to “jump risk” – that is significant intraday moves, with the potential for a sharp 10% equity market correction. Due to the aforementioned positioning (Nasdaq short gamma), the Nasdaq is likely to have a much sharper correction vs the S&P500.
A similar setup occurred into July of 2024, where stocks reached all-time highs off stellar NVDA performance. S&P500 correlation made record lows in early July ’24. Then, from mid-July to August 5th the S&P500 lost 9.5%. On August 5th 2024 the VIX surged to over 60.
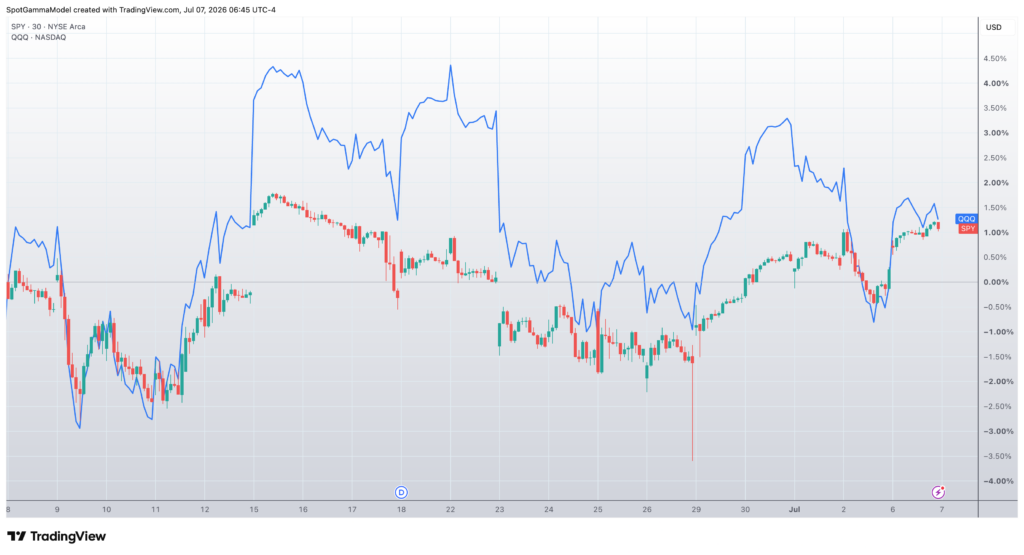
SPY lost 10% in July 2024, and the VIX peaked near 60 on August 5th 2024.
For longer term investors, the point of this paper isn’t really about volatility. It’s about identity. For years, investors treated SPY and QQQ as different versions of the same investment. I don’t think that’s true anymore. Nasdaq is intentionally becoming the home for younger, faster-growing, higher-volatility companies. The S&P has deliberately chosen a more conservative path. These choices should lead to different constituents, different return profiles and different volatility. The options market appears to have recognized that shift well before most investors.