• Skip to main content
  • Skip to primary sidebar

SpotGamma™

S&P 500 Stock Market Gamma Trading Levels Based on Options Open Interest

  • About
  • Pricing
  • Academy
  • Resources
    • Tool Demos
    • Case Studies
    • Blog
    • Support Center
    • Free Daily Report
    • Free Trading Tools
      • Options Profit Calculator
      • SPX Gamma Exposure
      • Implied Earnings Moves
      • Volatility Ranking
    • Free Training
    • Report Card
  • Login

Jan 21 2023

Implied Volatility Compresses at Stock Market Highs

SpotGamma sees evidence that we are at an interim high due to implied volatility compressing at levels which are near long term rates of realized volatility.
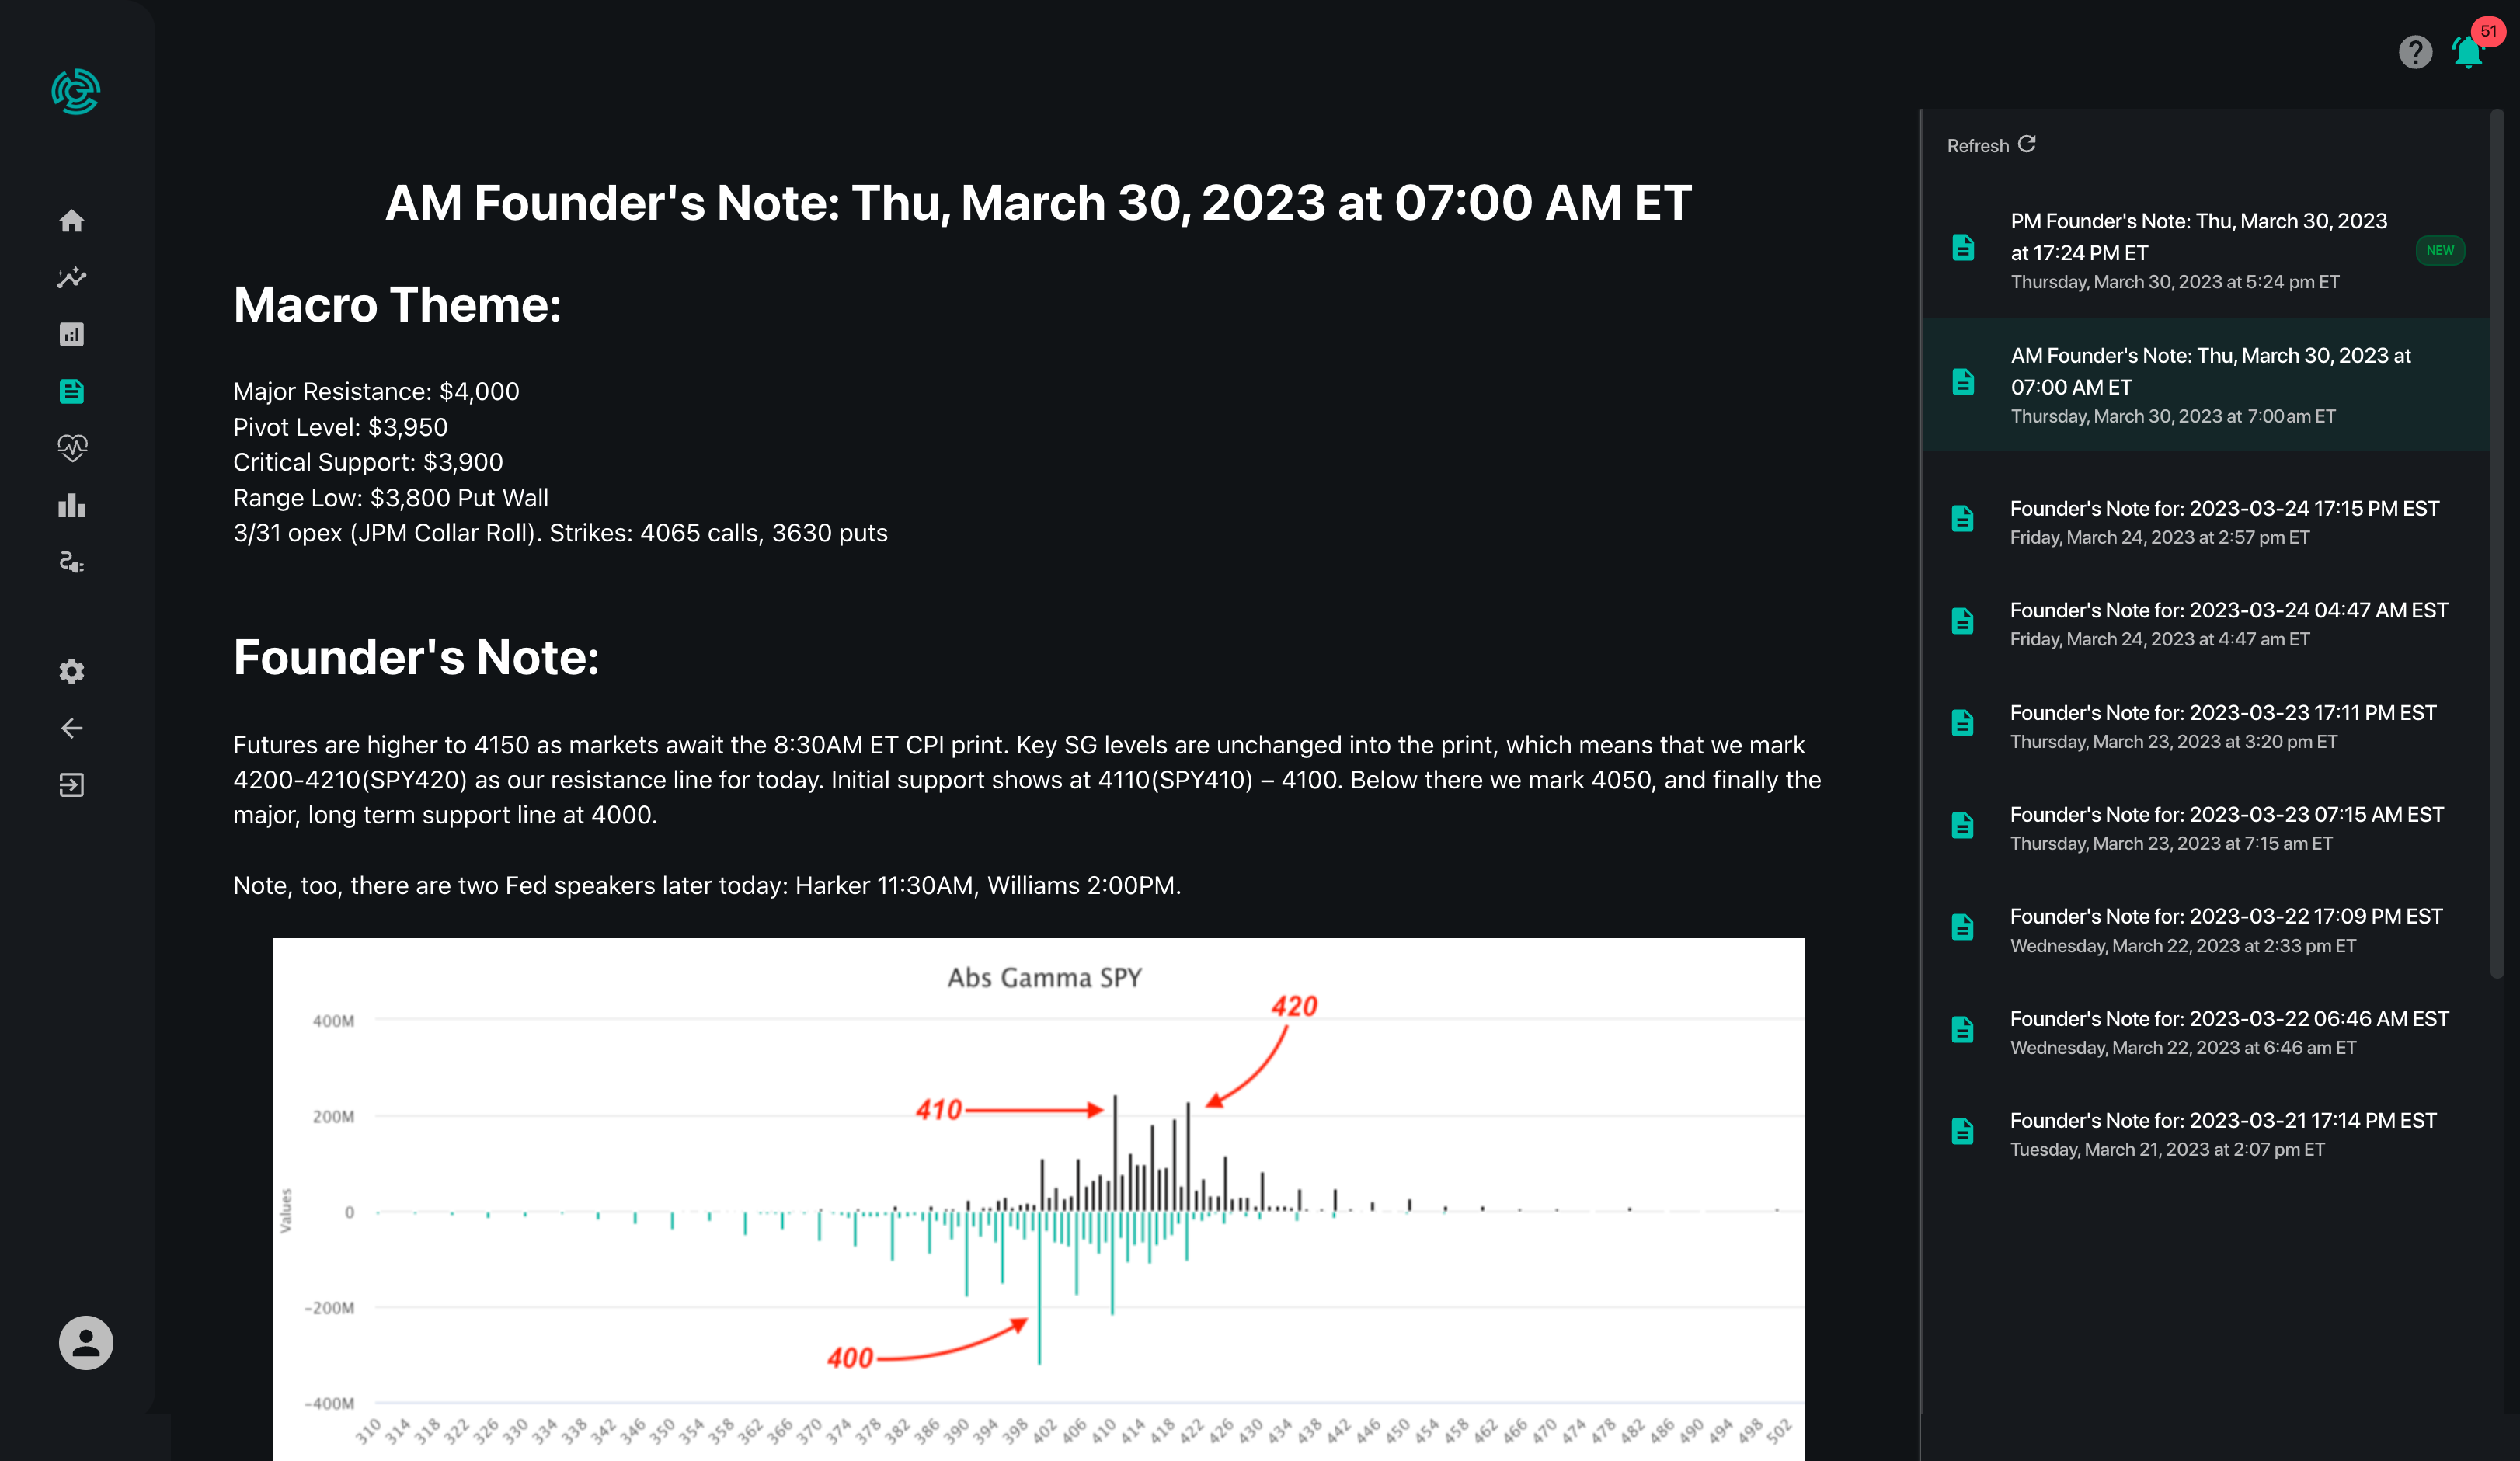
Modern-Founder's-Note-Mockup

In the chart below we have the SPX (green), 1 month realized volatility (RV), or, how much the SPX has been moving (orange), and 1 month implied volatility[IV], which tells us how much volatility traders expect in the future (white).
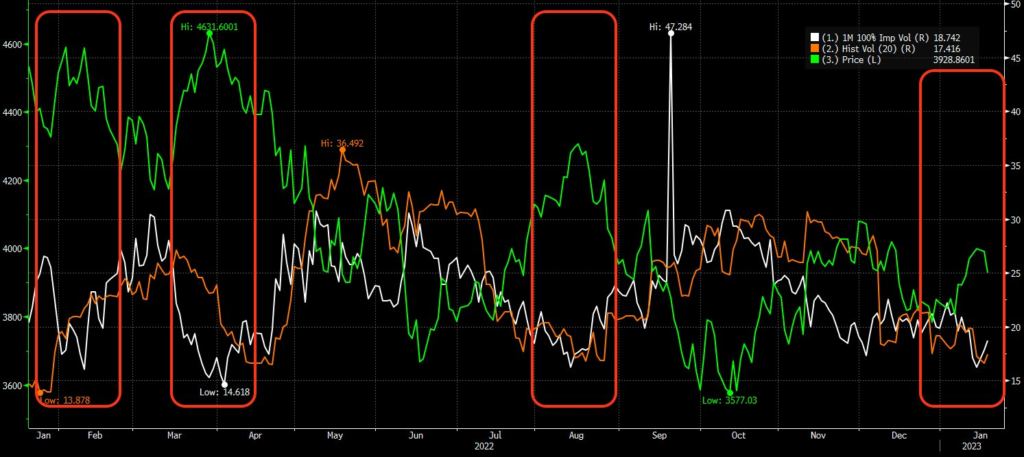
S&P500 Index vs 30 day implied volatility and 30 day realized volatility

In the red boxes above you can see that the spread between IV and RV compress as the market peaks. In other words, traders expectations about volatility in the future shifts under the rate of volatility we’ve been seeing. Its a signal that IV is too cheap, or risk(s) have cleared.

IV<RV is most common after a crisis & recovery Ex: the Covid Crash, people scrambled for hedges into Mar ’20 & then the Fed came with a bailout. After that, traders anxiety eased leading to a very sharp IV decline. RV is slower to decline, b/c its a rolling historical window
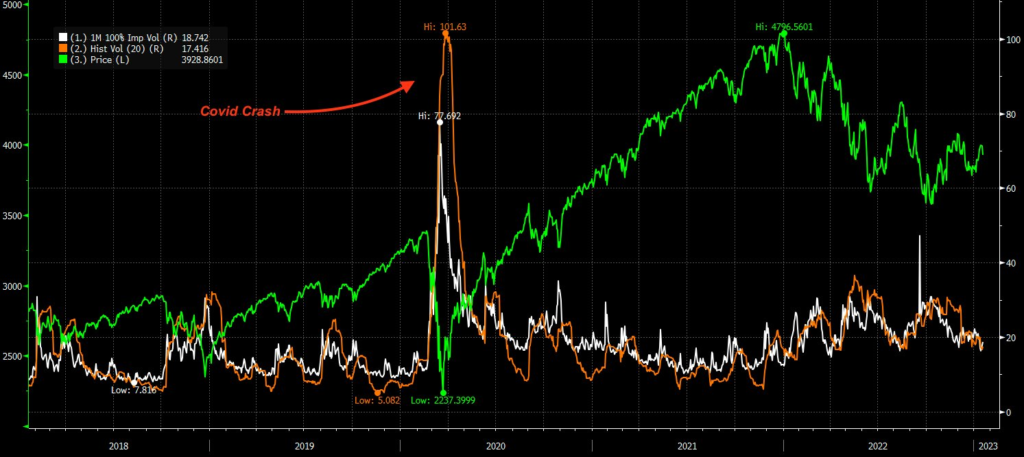
S&P500 Index vs 30 day implied volatility and 30 day realized volatility, 5 year chart

Recently there hasn’t been a huge IV increase, but there hasn’t been a true resolution to whats causing market volatility: namely interest rates. Plotted here is 10Y yields (purple) vs SPX (green). Of late there seems to be a clear inverse relationship.
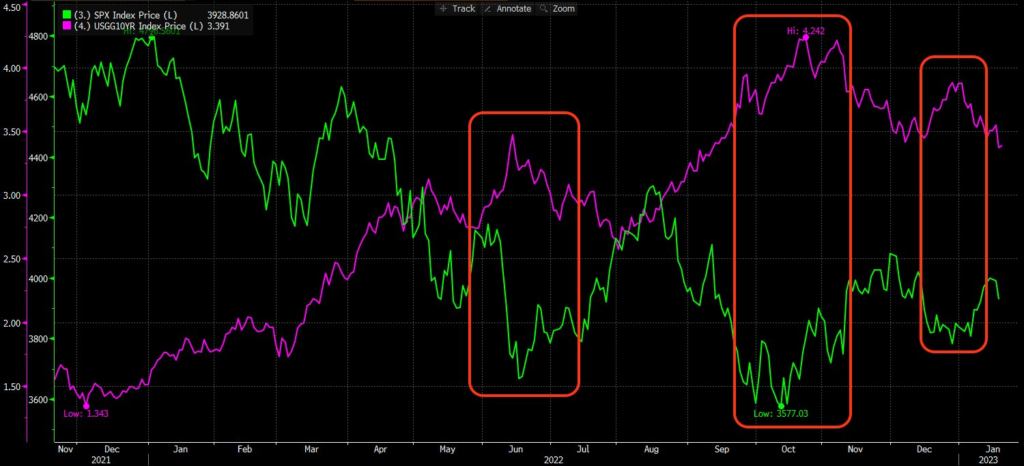
SPX vs 10 year Treasury Yield

We’ll leave it to macro folks to argue this: but as a base case rate uncertainly isn’t likely resolved until Powell says so. The risk isn’t officially cleared. Therefore we think IV <18 is too cheap/oversold because volatility (RV) should remain high due to these uncertainties.

Further, as rates increase ( + recession arguments) you can make a case that “fair value” on the SPX is lower. Consider this, per Citi: “The S&P 500’s trailing [PE] ratio is back to 18.2x, “dangerously close to the upper end of our fair value range,””

To this point, here is SPX (white) vs SPX P/E ratio (blue). As you can see PE ratios are now back to where they were going into March ’20. While this is down sharply from 2020 highs, it is still well above long term averages near 15.
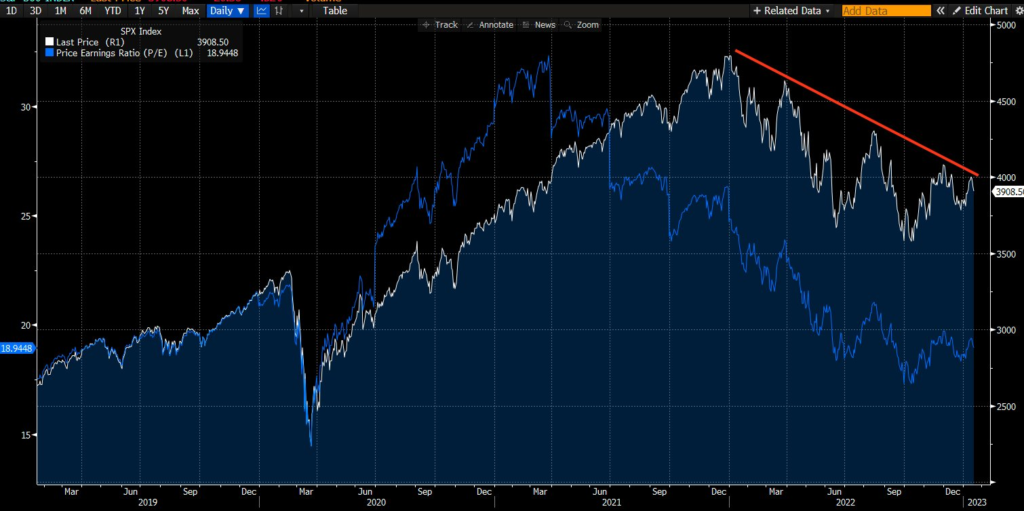
SPX vs SPX Price to Earnings Ratio

Often short covering & right tail (i.e. call buying) hedging leads to violent rallies. Eventually big buying demand meets big selling demand leading to IV/RV spread compression: an impasse in price. Lower valuations infer large sellers come out at increasingly lower SPX prices
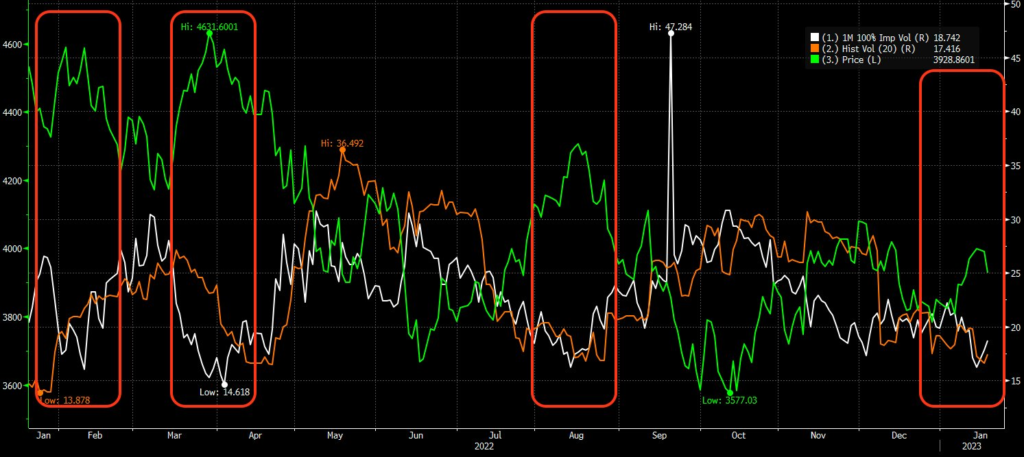
S&P500 Index vs 30 day implied volatility and 30 day realized volatility

Eventually when the Fed pauses, equity prices may stabilize which leads to lower levels of volatility and IV/RV levels closer to 15. Or, valuations get undeniably cheap.

Share This Article

  • Share
  • Twitter
  • LinkedIn
  • Reddit
  • Facebook

Written by SpotGamma · Categorized: Market Analysis

Don’t have an account with SpotGamma?

Choose the plan you want today to view unique support and resistance levels, access Founder’s Notes and expert commentary, daily trading ranges, and entrance into our private Discord.


Primary Sidebar

Related Resources

  • Another SpaceX Unlock, and Why $150 Still Caps the Stock

    Another SpaceX Unlock, and Why $150 Still Caps the Stock

    August 20, 2026
  • Options Exchange Monitor — Week of August 15, 2026 (36 SEC notices, 2 CFTC, 0 EDGAR)

    Options Exchange Monitor — Week of August 15, 2026 (36 SEC notices, 2 CFTC, 0 EDGAR)

    August 17, 2026
  • GEX Levels for SPY, QQQ, ES and NQ: Using Index Gamma in Any Product

    GEX Levels for SPY, QQQ, ES and NQ: Using Index Gamma in Any Product

    August 17, 2026
  • How to Trade GEX Levels: A Practical Guide to Gamma-Based Trading

    How to Trade GEX Levels: A Practical Guide to Gamma-Based Trading

    August 17, 2026
  • Free GEX Levels, Charts, and Data: What’s Available and What It’s Actually Worth

    Free GEX Levels, Charts, and Data: What’s Available and What It’s Actually Worth

    August 17, 2026
  • youtube
  • x
  • Privacy Policy
  • Disclaimer
  • Terms & Conditions
  • Support Center
  • Media
  • Contact Us

©2026 TenTen Capital LLC DBA SpotGamma

All SpotGamma materials, information, and presentations are for educational purposes only and should not be considered specific investment advice nor recommendations. Futures, foreign currency and options trading contains substantial risk and is not for every investor. An investor could potentially lose all or more than the initial investment. Risk capital is money that can be lost without jeopardizing one's financial security or lifestyle. Only risk capital should be used for trading and only those with sufficient risk capital should consider trading. Past performance is not necessarily indicative of future results. Testimonials appearing on this website may not be representative of other clients or customers and is not a guarantee of future performance or success.

View Full Risk Disclosure