• Skip to main content
  • Skip to primary sidebar

SpotGamma™

S&P 500 Stock Market Gamma Trading Levels Based on Options Open Interest

  • About
  • Pricing
  • Academy
  • Resources
    • Tool Demos
    • Case Studies
    • Blog
    • Support Center
    • Free Daily Report
    • Free Trading Tools
      • Options Profit Calculator
      • SPX Gamma Exposure
      • Implied Earnings Moves
      • Volatility Ranking
    • Free Training
    • Report Card
  • Login

Sep 08 2020

No, Softbank Didn’t Weaponize Options Gamma

One of the biggest stories at the moment is that of Softbank and their massive options positions which many are attributing to the markets large runup in late August. There are a ton of stories and opinions floating around on this topic and we thought it warranted a bit of mapping to clear some truths and misconceptions.

In our view SoftBank likely did NOT have the impact the media is portraying. However, there was a large increase in call option activity likely from a wide array of sources which may have influenced volatility.

The pink link in the graph below highlights the rise in single stock call activity. This activity is something many have been talking about for several months.
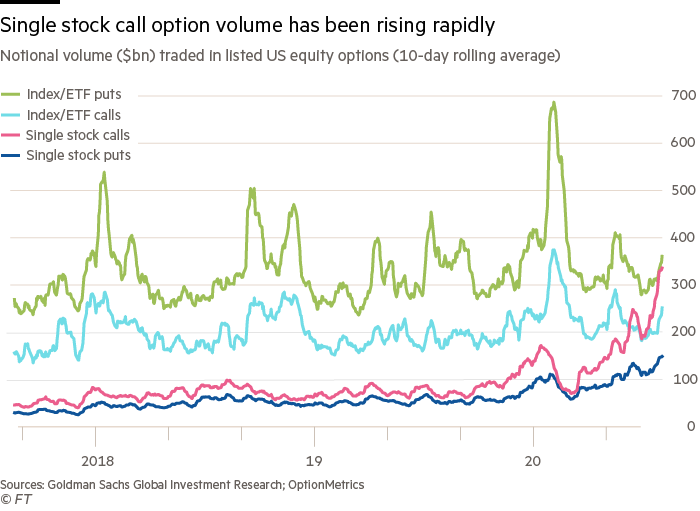
Single stock call option volume has been rising rapidly
Options Volumes Index, Single Stock

Here are some background articles on this Softbank topic, the main narrative appears to be that SoftBanks’s options activity is particularly responsible for the recent volatility.

  • ZeroHedge: Connecting The Dots: How SoftBank Made Billions Using The Biggest “Gamma Squeeze” In History
  • FT: SoftBank unmasked as ‘Nasdaq whale’ that stoked tech rally

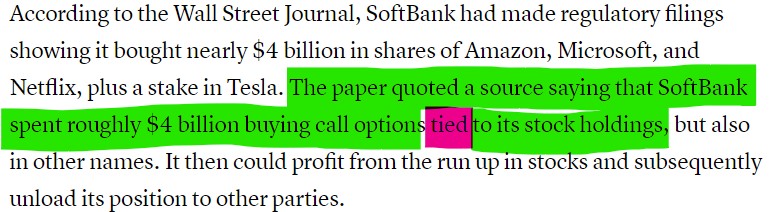
However, a key line from CNBC denotes these options positions were tied to stock, which is also backed by Ben Eifert’s twitter thread, below.

  • Key quote from CNBC article:
  • Eifert Twitter Thread

Courtesy of Yakob Peterseil, you can see where large trades were posted in some of the tickers SoftBank was reported to be in. Note these are all spreads, not single legs:
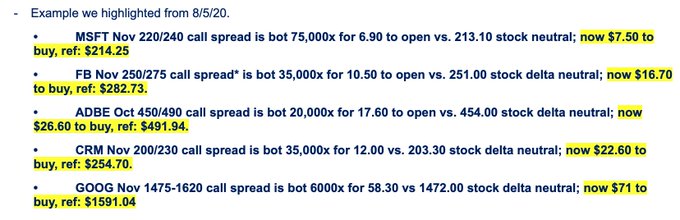
Image

Below is a chart of the aggregate of options gamma and open interest for many of the names that SoftBank was invested in. Note that open interest levels in particular do NOT appear to materially change from June to September. You may also notice there is a “cycle” to this data tied to options expiration (6/19, 7/17, 8/21).
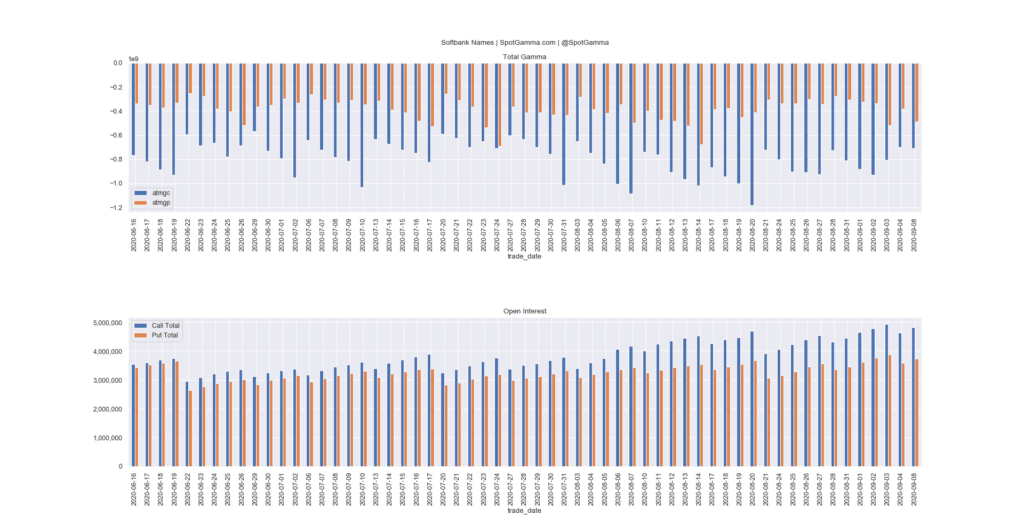
Options open interest and gamma in SoftBank positions.

We plotted total open interest in the chart below for ADBE, and you can see some major positions popped up in early August. Those strikes that spike earliest are the 450 (blue) and 490 (pink). The fact these spike on the same day would support the idea that this was a spread position added, not a single position. This also ties back into the dates noted in Yakob’s image above.
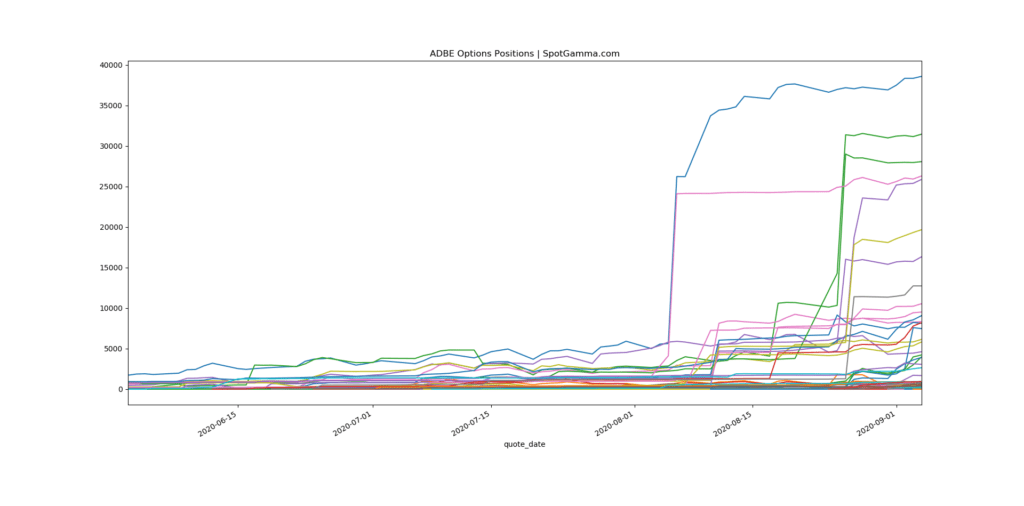
ADBE softbank options open interest
ADBE stock open interest

MSFT is another stock mentioned in the SoftBank articles. Right around the same time as the large ADBE increase we see moves up in MSFT open interest. In this case the largest position increases appeared to be in the 220 and 240 strikes. As MSFT options activity is much larger than ADBE there is a bit more noise, but you can see the two strikes increase sharply on the same day.
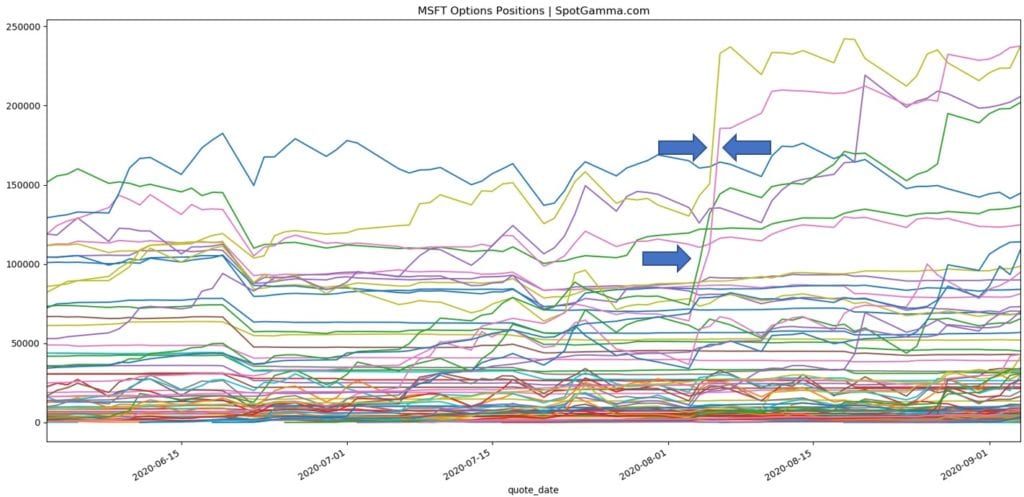
MSFT Softbank options  open interest
MSFT Open Interest

Our view is that these trades may have been done for the following reasons:

  • Stock replacement – replace long stock positions with call spreads to reduce risk
  • Long volatility – in theory these call positions would make money if call implied volatility spiked higher.

With this in mind it seems like these trades would have reduced overall exposure to higher stock prices, and likely not had the “gamma impact” that many pundits projected.

Share This Article

  • Share
  • Twitter
  • LinkedIn
  • Reddit
  • Facebook

Written by SpotGamma · Categorized: Market Analysis

Don’t have an account with SpotGamma?

Choose the plan you want today to view unique support and resistance levels, access Founder’s Notes and expert commentary, daily trading ranges, and entrance into our private Discord.


Primary Sidebar

Related Resources

  • Options Exchange Monitor — Week of August 15, 2026 (36 SEC notices, 2 CFTC, 0 EDGAR)

    Options Exchange Monitor — Week of August 15, 2026 (36 SEC notices, 2 CFTC, 0 EDGAR)

    August 17, 2026
  • GEX Levels for SPY, QQQ, ES and NQ: Using Index Gamma in Any Product

    GEX Levels for SPY, QQQ, ES and NQ: Using Index Gamma in Any Product

    August 17, 2026
  • How to Trade GEX Levels: A Practical Guide to Gamma-Based Trading

    How to Trade GEX Levels: A Practical Guide to Gamma-Based Trading

    August 17, 2026
  • Free GEX Levels, Charts, and Data: What’s Available and What It’s Actually Worth

    Free GEX Levels, Charts, and Data: What’s Available and What It’s Actually Worth

    August 17, 2026
  • Covered Calls After Assignment: What to Do When the Stock Drops Below Your Cost Basis

    Covered Calls After Assignment: What to Do When the Stock Drops Below Your Cost Basis

    August 17, 2026
  • youtube
  • x
  • Privacy Policy
  • Disclaimer
  • Terms & Conditions
  • Support Center
  • Media
  • Contact Us

©2026 TenTen Capital LLC DBA SpotGamma

All SpotGamma materials, information, and presentations are for educational purposes only and should not be considered specific investment advice nor recommendations. Futures, foreign currency and options trading contains substantial risk and is not for every investor. An investor could potentially lose all or more than the initial investment. Risk capital is money that can be lost without jeopardizing one's financial security or lifestyle. Only risk capital should be used for trading and only those with sufficient risk capital should consider trading. Past performance is not necessarily indicative of future results. Testimonials appearing on this website may not be representative of other clients or customers and is not a guarantee of future performance or success.

View Full Risk Disclosure