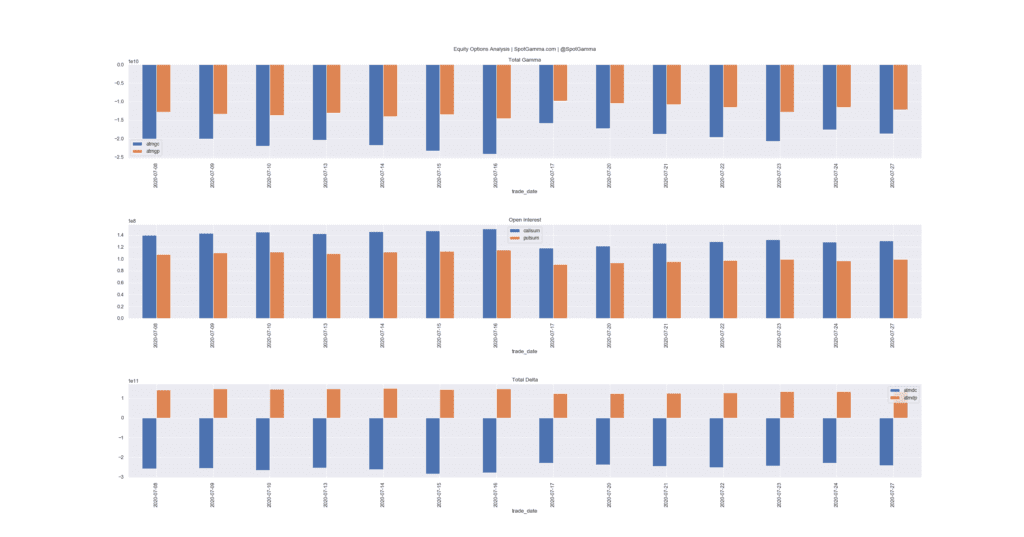
The following charts represent the most important dynamic in equity markets. It can be summarized by this:
Massive call demand has pushed call prices way up, driving huge amounts of stock volume.
Record levels of single stock call options were purchased into June expiration, reloaded back to record levels in July, and are now rebuilding again as you can see in the chart below. There are many possible reasons for this, including major buying from retail.

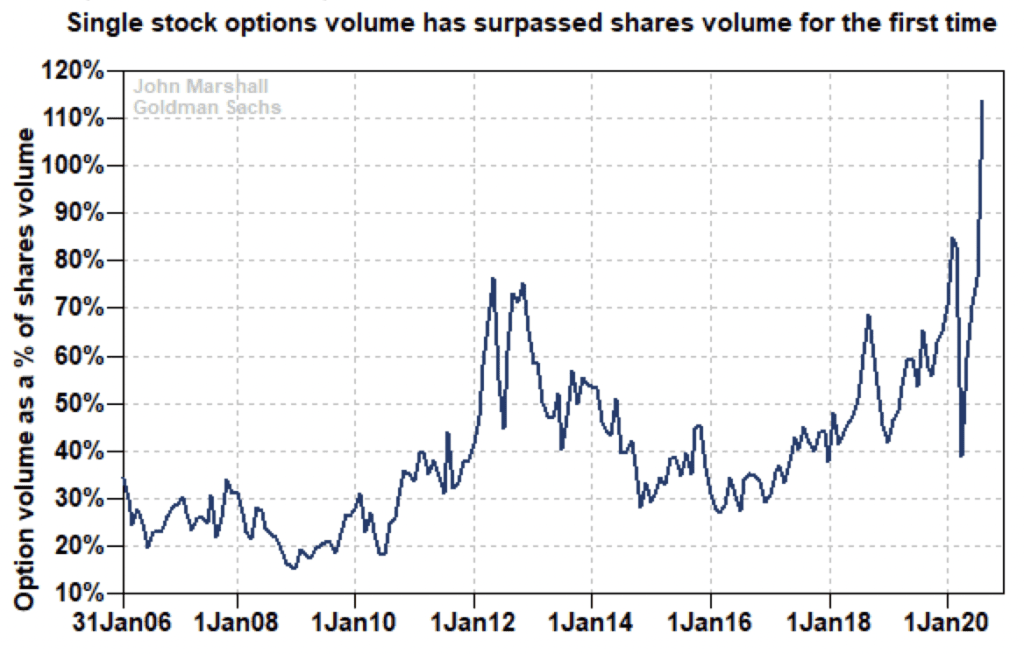
The impact of this is highlighted in the chart below from Goldman. Single stock options volume has surpassed share volume. Essentially options and the hedging volume tied to options are now larger than “regular share” volume. When a trader goes and buys a call, a dealer is then short that call (and is in a negative gamma position). To hedge, the dealer may then buy shares.

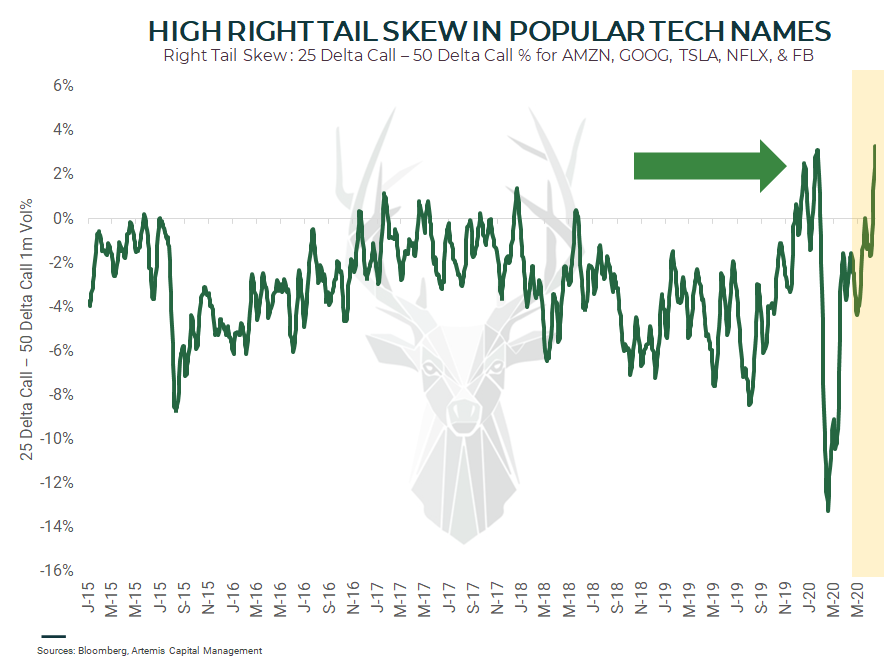
Finally we show this skew chart from Artemis capital which highlights that demand for out of the money calls is at levels last seen in the late ’90s.

This is a dynamic which can drive market volatility as dealers must hedge these call options. Because dealers are in a negative gamma position they may buy as these stocks go up, and sell as the stocks drop. This can expand market volatility as dealers push stocks in the prevailing direction.
When new call positions are added this pushes dealers to buy more stock, which may push the stock higher. This can drive more call demand, which drives more hedging – a reflexive cycle known as a gamma trap.
At some point this dynamic will likely break and unwind, but timing that is rather difficult. Call buyers have been having a great deal of success since the March lows, and have the “stocks only go up” sentiment.
