Macro Theme: |
Key Levels: |
| >Major resistance: $3,900 (SPY Call Wall) >Major support: $3,800 (SPY Put Wall) >Critical Dates: 1/4 FOMC Mins, 1/20 Jan OPEX >Major risk lies on a break of 3800, as dealers may flip to negative gamma hedging | Ref Price: 3824 SG Implied 1-Day Move: 1.28% SG Implied 5-Day Move: 2.89% Volatility Trigger: 3840 Absolute Gamma Strike: 4000 Call Wall: 4000 Put Wall: 3700 |
Daily Note:
Futures are higher to 3860 ahead of todays 2pm ET FOMC minutes. There were little change to SG levels overnight. First resistance is at 3840-3850, then 3900. Above 3900 there remains a resistance gap to 4000. Large support lies at 3800, then 3766 (SPY 375).
Our core theme of “grinding lower” vs “crashing higher” remains in play (see yesterdays AM note), and today’s Minutes could be an interesting catalyst in that regard.
This is because FOMC minutes have been a source for volatility as of late, and we anticipate that being the case again, today. With that, if the S&P can close >=3900 we think that invokes a test of the large 4000 gamma area by week end. Conversely, a close <=3800 likely leads to a test of the 3700 Put Wall. The key point here is that we believe that the S&P is likely to now dislodge from the 38xx’s.
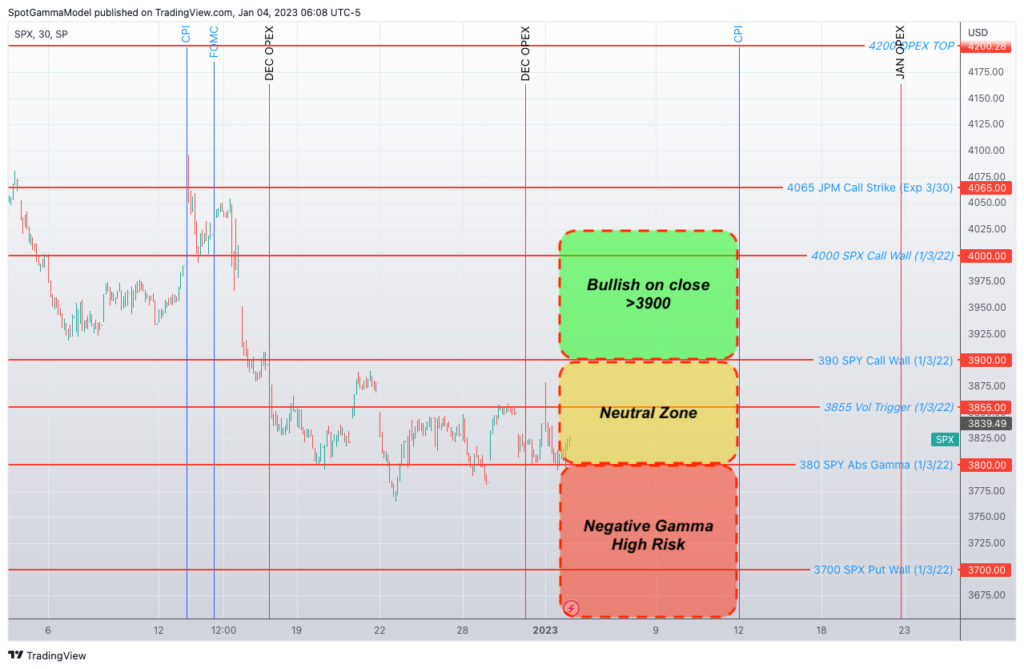
While markets seemed poised to rally yesterday, bad news from TSLA & AAPL served to clip that setup. However, that failed to materially frighten markets as the large 3800 support level held, and implied volatility remained contained. There was a small pickup in some IV measurements, for example the VIX and our Risk Reversal readings, but that appears be unwound this AM.
This price action is essentially that which has been on display for the last several weeks. Bears have been given every opportunity to drive price lower, but long put demand remains muted. As a result there seems to be a failure for material negative gamma to pick up. The downside risk lies in that if markets slide lower toward 1/20 expiration, that can energize those Jan put options and function to pull markets lower. This scenario gains probability on a close under 3800, particularly as we move forward in time towards Jan 20.
Currently we are simply wallowing in the “neutral zone” as shown on the chart map above. What we need here is for markets to show their hand (>3900 or <3800) which should spark a tradable OPEX trend. Given that, we believe new options positions will be initiated which could serve to reinforce price action into 1/20 OPEX.
| SpotGamma Proprietary SPX Levels | Latest Data | SPX Previous | SPY | NDX | QQQ |
|---|---|---|---|---|---|
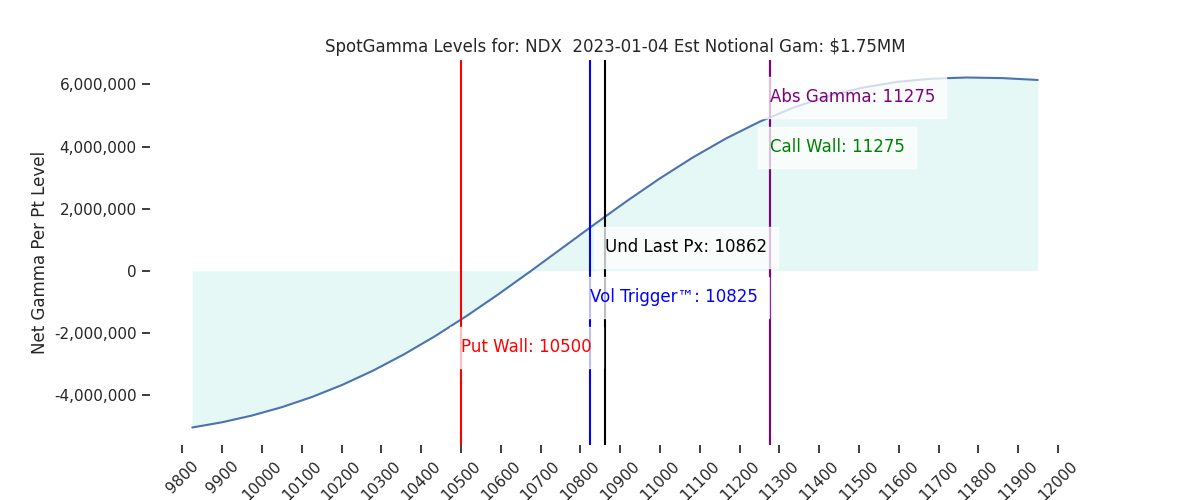
| Ref Price: | 3824 | 3839 | 380 | 10862 | 264 |
| SG Implied 1-Day Move:: | 1.28%, | (±pts): 49.0 | VIX 1 Day Impl. Move:1.44% | ||
| SG Implied 5-Day Move: | 2.89% | 3839 (Monday Ref Price) | Range: 3729.0 | 3951.0 | ||
| SpotGamma Gamma Index™: | -0.93 | -0.61 | 0.00 | 0.01 | -0.06 |
| Volatility Trigger™: | 3840 | 3855 | 130 | 10825 | 265 |
| SpotGamma Absolute Gamma Strike: | 4000 | 4000 | 400 | 11275 | 265 |
| Gamma Notional(MM): | -496.0 | -366.0 | 6.0 | 2.0 | -472.0 |
| Put Wall: | 3700 | 3700 | 405 | 10500 | 260 |
| Call Wall : | 4000 | 4000 | 455 | 11275 | 271 |
| Additional Key Levels | Latest Data | Previous | SPY | NDX | QQQ |
|---|---|---|---|---|---|
| Zero Gamma Level: | 3913 | 3900 | -25 | 10698.0 | 299 |
| CP Gam Tilt: | 0.73 | 0.79 | 2.11 | 1.17 | 0.69 |
| Delta Neutral Px: | 3937 | ||||
| Net Delta(MM): | $1,339,831 | $1,408,688 | $2,107 | $38,341 | $78,484 |
| 25D Risk Reversal | -0.05 | -0.04 | -0.04 | -0.05 | -0.05 |
| Call Volume | 488,698 | 512,338 | 1,906,635 | 8,940 | 799,560 |
| Put Volume | 892,814 | 1,000,641 | 2,349,922 | 9,893 | 861,313 |
| Call Open Interest | 5,248,810 | 5,373,115 | 119,019 | 58,639 | 4,567,472 |
| Put Open Interest | 9,673,237 | 9,477,592 | 48,347 | 54,070 | 5,834,801 |
| Key Support & Resistance Strikes: |
|---|
| SPX: [4000, 3900, 3850, 3800] |
| SPY: [455, 415, 405, 400] |
| QQQ: [280, 270, 265, 260] |
| NDX:[12000, 11500, 11275, 11000] |
| SPX Combo (strike, %ile): [(4000.0, 81.52), (3801.0, 95.08), (3786.0, 86.03), (3774.0, 90.51), (3751.0, 93.38), (3725.0, 83.08), (3702.0, 95.94), (3675.0, 76.81), (3648.0, 89.21)] |
| SPY Combo: [368.63, 378.54, 373.58, 375.87, 363.3] |
| NDX Combo: [11275.0, 10678.0, 10472.0] |
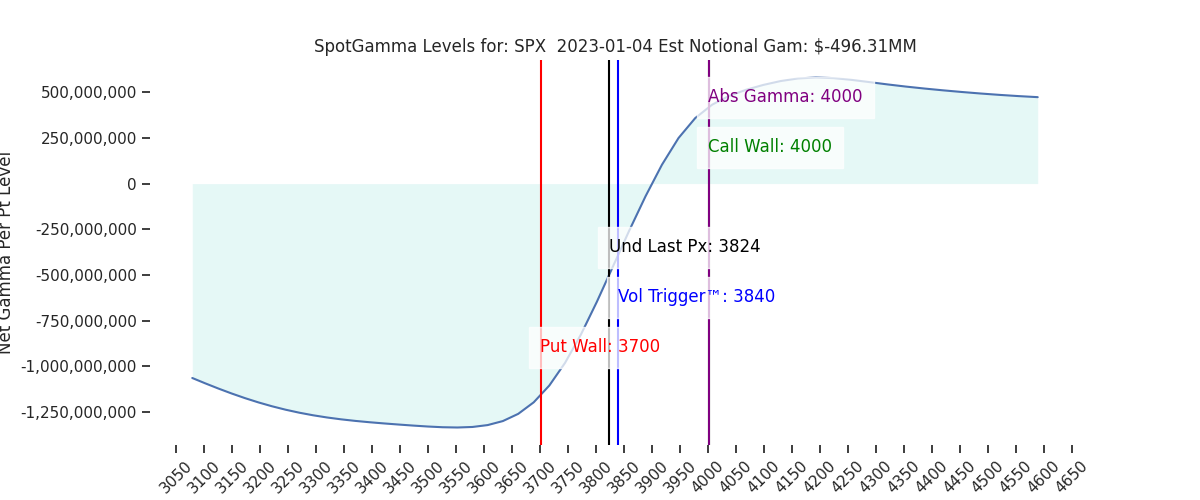
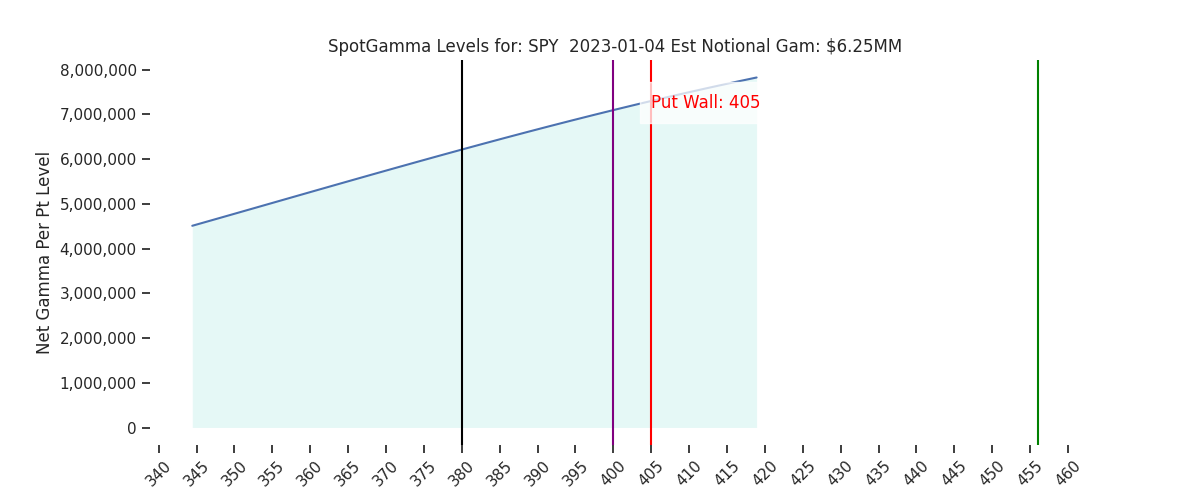
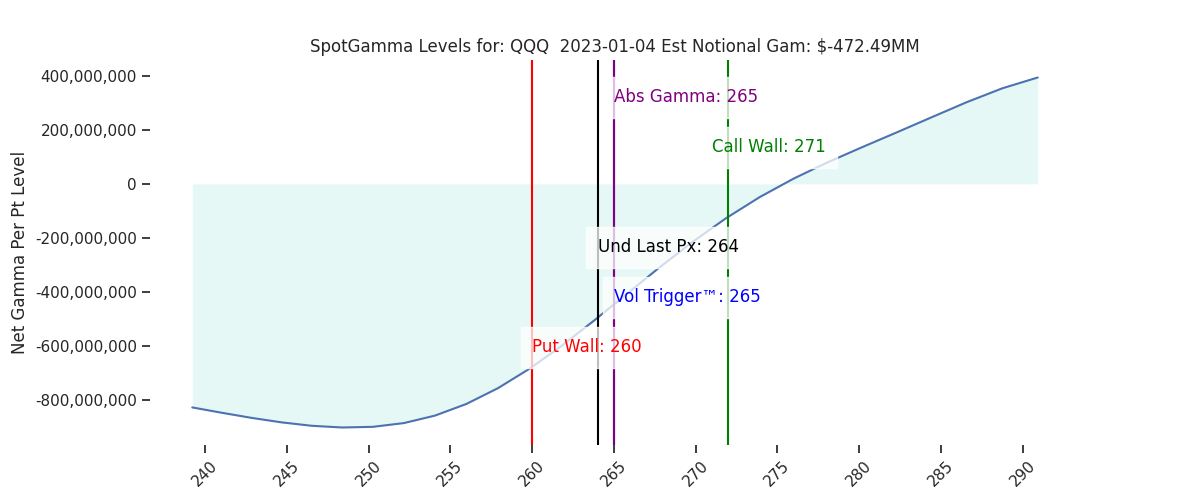
| ©TenTen Capital LLC d.b.a. SpotGamma Please leave us a review: Click Here |
| See the FAQ for more information on reading the SpotGamma graph. |
| SpotGamma provides this information for research purposes only. It is not investment advice. SpotGamma is not qualified to provide investment advice, nor does it guarantee the accuracy of the information provided. This email is intended solely for subscribers, please do not distribute the information without the express written consent of SpotGamma.com. |