• Skip to main content
  • Skip to primary sidebar

SpotGamma™

S&P 500 Stock Market Gamma Trading Levels Based on Options Open Interest

  • About
  • Pricing
  • Academy
  • Resources
    • Tool Demos
    • Case Studies
    • Blog
    • Support Center
    • Free Daily Report
    • Free Trading Tools
      • Options Profit Calculator
      • SPX Gamma Exposure
      • Implied Earnings Moves
      • Volatility Ranking
    • Free Training
    • Report Card
  • Login

Apr 05 2020

The Option Pin / Sticky Strike

Friday (4/3/20) was an interesting day in the S&P500 market due to its rotating action around the 2500 strike. We had several data points that led us to believe that this strike would be key to the action on Friday and wanted to highlight those points. Most of these charts are only available to subscribers but we happened to post this signal out on twitter when the SPX was around 2475:

2500 may not go down without a fight. Its the largest OI level and very active with volume today. $SPX pic.twitter.com/3QqqTcdTsi

— spotgamma (@spotgamma) April 3, 2020

You can see in the SPX chart below that 2500 was a “sticky strike” and revisited by the market several times.
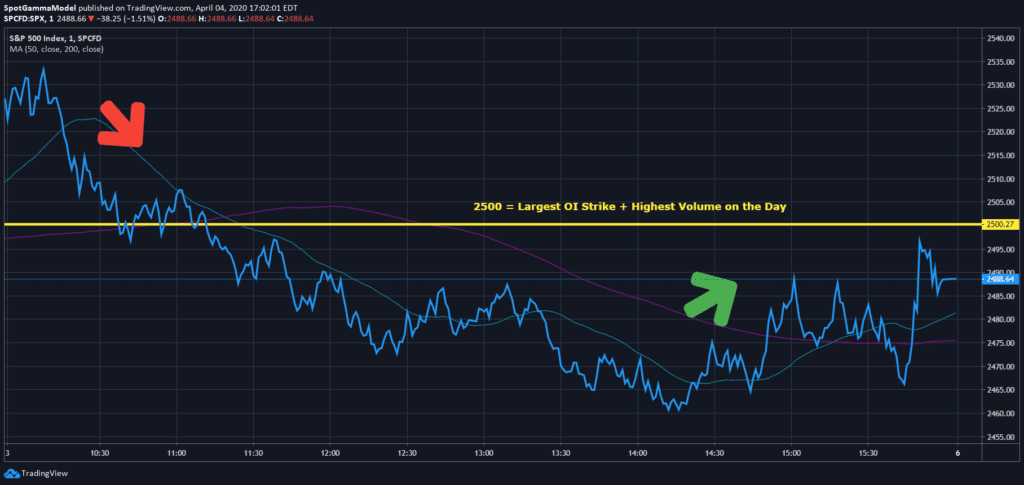
SPX Options Pin due to large options open interest and options volume.

There are two components we feel contributed to this market action: open interest and volume. As you can see in our gamma chart below, the largest gamma strike was at 2500. This is different from looking at open interest by number of contracts because we weight the open interest with gamma. Open interest may be irrelevant if the strike is way out of the money, so we prefer to look at this gamma weighted open interest metric.
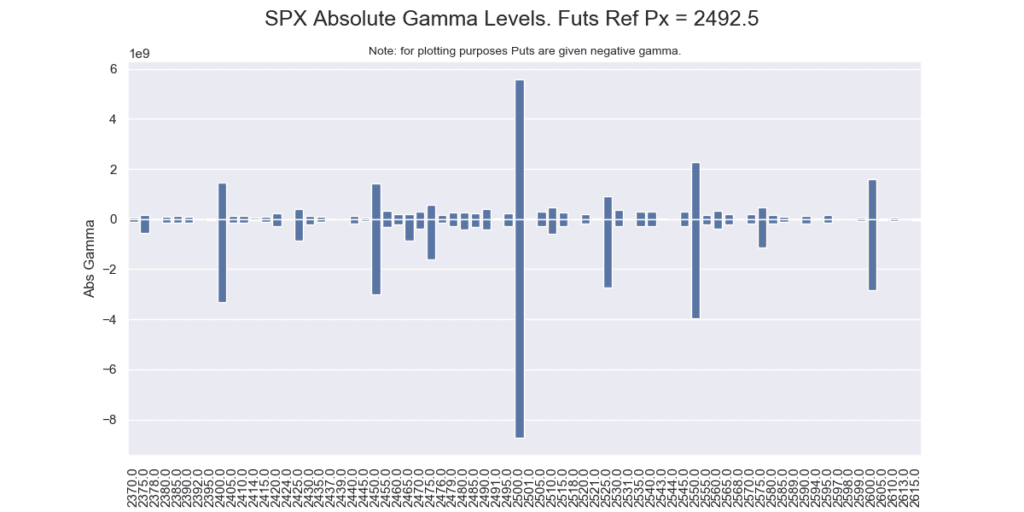
SpotGamma Absolute Options Gamma Chart

We think that these high gamma strikes draw hedging activity that influences the market to revolve around that level. This can create something like a “wide range” options pin wherein we tag the level throughout the day as you can see in the SPX price chart at the top of this post.

The second key piece of data is volume. This is both options volume and futures/equity volume. If the volume at the high gamma strike (2500 in this example) is high that can create even more hedging activity tied to that strike. You can see in the chart below that 2500 strike volume was quite high on Thursday, but also Friday as well. We provide charts for subscribers that show the daily change in open interest and volume to help identify these situations.
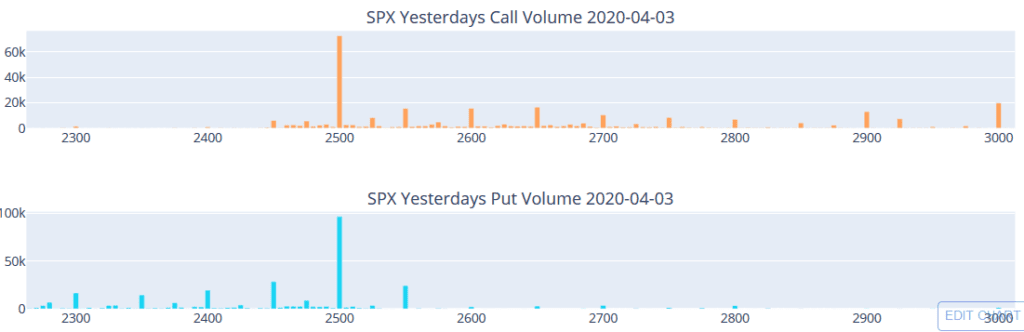
SPX Put Call Volume for 4/2/20 in the 4/3/20 report

The last piece of this setup is to have light futures/equity volume in comparison to options volume. Lower relative volumes in futures mean that the hedging activities of options traders has more impact on the futures market, as options hedging is a higher percentage of equity/futures volume. You can see in the chart below from the CME that futures volume was down compared to previous days.
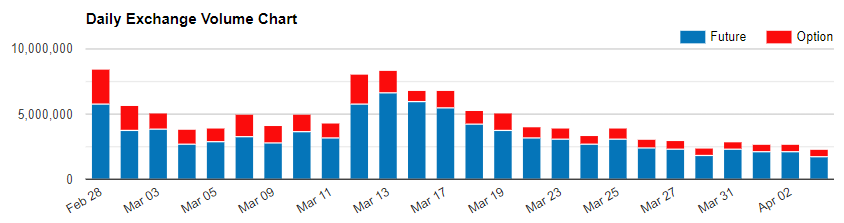
CME Futures Volume
CME Futures Volume

Note that our discussion here is in regards to SPX index options, we believe options market makers hedge SPX options with ES futures. Therefore those active in SPY or ES futures trading may be able to incorporate this data into their trading.


Access the charts above, plus daily analysis: Subscribe now!

Share This Article

  • Share
  • Twitter
  • LinkedIn
  • Reddit
  • Facebook

Written by tenten · Categorized: Market Analysis · Tagged: futures volume, open interest, options pin, options volume, pin risk

Don’t have an account with SpotGamma?

Choose the plan you want today to view unique support and resistance levels, access Founder’s Notes and expert commentary, daily trading ranges, and entrance into our private Discord.


Primary Sidebar

Related Resources

  • Welcome to the Summer Melt-Up

    Welcome to the Summer Melt-Up

    August 9, 2026
  • The Machine Ran on Call Skew: What MSTR’s Dead Volatility Surface Says About Strategy — and Bitcoin’s Missing Bid

    The Machine Ran on Call Skew: What MSTR’s Dead Volatility Surface Says About Strategy — and Bitcoin’s Missing Bid

    August 3, 2026
  • The New Normal in Volatility Takes Shape

    The New Normal in Volatility Takes Shape

    August 2, 2026
  • Anatomy of a Margin Call: How Situational Awareness LP Unwound a $20 Billion AI Book in One Trade

    Anatomy of a Margin Call: How Situational Awareness LP Unwound a $20 Billion AI Book in One Trade

    July 30, 2026
  • Big Tech Earnings and FOMC Collide

    Big Tech Earnings and FOMC Collide

    July 26, 2026
  • youtube
  • x
  • Privacy Policy
  • Disclaimer
  • Terms & Conditions
  • Support Center
  • Media
  • Contact Us

©2026 TenTen Capital LLC DBA SpotGamma

All SpotGamma materials, information, and presentations are for educational purposes only and should not be considered specific investment advice nor recommendations. Futures, foreign currency and options trading contains substantial risk and is not for every investor. An investor could potentially lose all or more than the initial investment. Risk capital is money that can be lost without jeopardizing one's financial security or lifestyle. Only risk capital should be used for trading and only those with sufficient risk capital should consider trading. Past performance is not necessarily indicative of future results. Testimonials appearing on this website may not be representative of other clients or customers and is not a guarantee of future performance or success.

View Full Risk Disclosure