Dealer Hedging Turned a Decline Into a Rout
Last week brought one of the most severe single-day declines in recent market history. On Thursday, the S&P 500 fell 4.4% to 7,354 while the Nasdaq 100 dropped 6.4%, its worst session since 2020. The selloff erased Wednesday’s post-election rally, raising questions about the future of the AI trade.
Headlines assigned catalysts to Democrats’ sweep of the midterm elections and concerns of slowing AI data center buildout. Semiconductors took the brunt of the damage, with SOXX falling more than 12% and memory stocks dropping nearly 18% on Thursday alone.
The ferocity of Thursday’s decline came in large part due to options positioning. In last Sunday’s newsletter we warned traders to “remain wary of a possible drop towards 7,400, where negative dealer gamma peaks.”
Negative dealer gamma describes a market in which options dealers hedge in the same direction as price. As the market falls, dealers sell to stay hedged, this can amplify the move. Similarly, Thursday’s pre-market Founder’s Note described SPX support as “gappy, and sparse,” with downside that “likely comes with sharp IV expansion.”
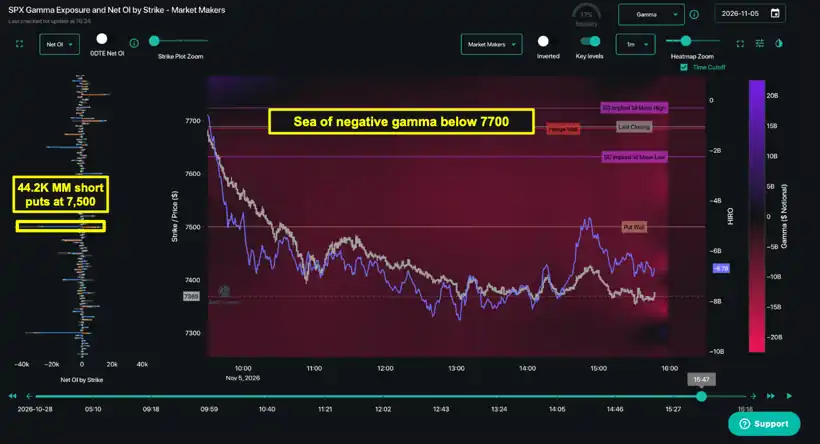
On Thursday, SPX opened just below our 7,690 Risk Pivot, the level below which our model turns risk-off. By 10:25 a.m. ET, the index had broken through both 7,600 and 7,500.
As shown above, our TRACE heatmap on Thursday indicated negative gamma (red) across virtually the entire range below the Risk Pivot. The 7,500 strike in particular showed market makers short 44,000 puts, which accelerated the SPX selloff through that strike.
How Volatility Added Fuel to the Selloff
As prices fell, implied volatility (IV) rose sharply. IV reflects the price traders pay for options, based on expected future movement, and rising IV matters for dealers because of the vega effect. As IV climbs, the puts dealers are short gain value and behave more like stock, so dealers must sell even more to stay hedged.
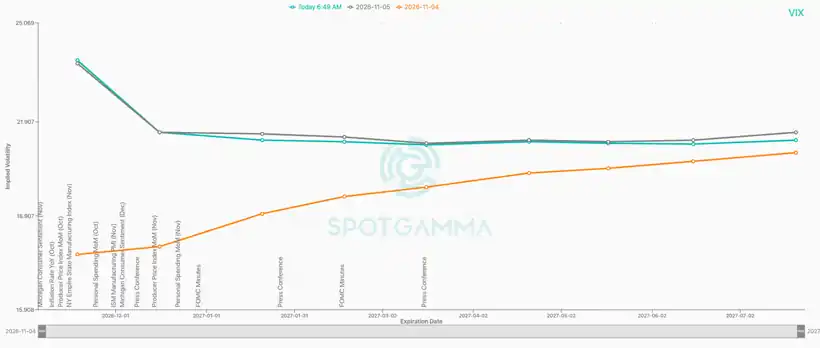
On Thursday, the VIX posted its third-largest one-day percentage gain since 1990. Even after Friday’s strong jobs report, the VIX remains well above where it began the week. Near-term IV eased, but one-month IV barely moved. Put skew began spiking in particular, suggesting a move towards protection.
Over the past year we have written about 0DTE options as a steadying, short-term force in the market. Traders who sell zero-days-to-expiration (0DTE) options often leave dealers with positive gamma at nearby strikes. On Thursday, those 0DTE sellers largely stepped back, which further removed any shock absorbers from the market.
The Next Two Weeks Could Test the Market
SpotGamma’s models now show negative gamma (red zones, in the heatmap below) extending from roughly 7,000 up into 7,550. Much of this positioning is tied to the monthly options expiration on November 20. Until those positions clear, the data suggests larger price swings in either direction remain likely.
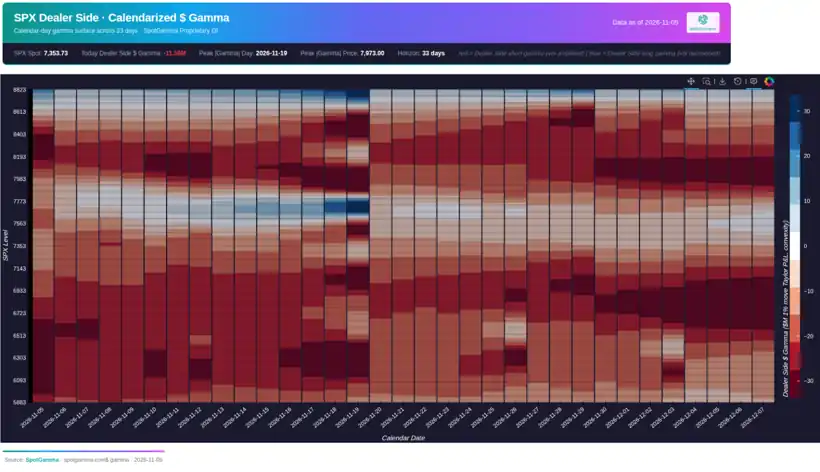
The calendar may offer a path toward stabilization. NVDA reports earnings on November 17, VIX options expire November 18, and monthly OPEX follows on November 20. That sequence leads into the shortened Thanksgiving week, which can accelerate volatility decay as event risk clears.
Before that stretch begins, this week brings inflation data and several AI infrastructure reports that could test the market’s footing:
- Tuesday, Nov. 10: October CPI (8:30 a.m. ET); CoreWeave (CRWV) earnings after the close
- Thursday, Nov. 12: Nebius (NBIS) before the open; Cisco (CSCO) and Applied Materials (AMAT) after the close
- Friday, Nov. 13: October PPI
Thursday showed how quickly options positioning can turn a headline event into one of the sharpest selloffs in years. Until November OPEX clears that positioning, dealer positioning remains critical as a possible accelerant of price action.
Single Stock Radar: Expensive Volatility and More AI Earnings Ahead
For single stock traders, hedging has become costly. Most single stocks and major equity indexes now carry IV Ranks of 50 or higher, with several tech names at 90 or above. That means options on many tech stocks are priced near the top of their one-year range.
Bitcoin (BTC) remains one notable exception. Even after BTC fell about 5% on Thursday, crypto ETF IBIT remains one of the few places where implied volatility looks relatively cheap. If markets move into a true crisis, bitcoin could see outsized selling relative to equities.
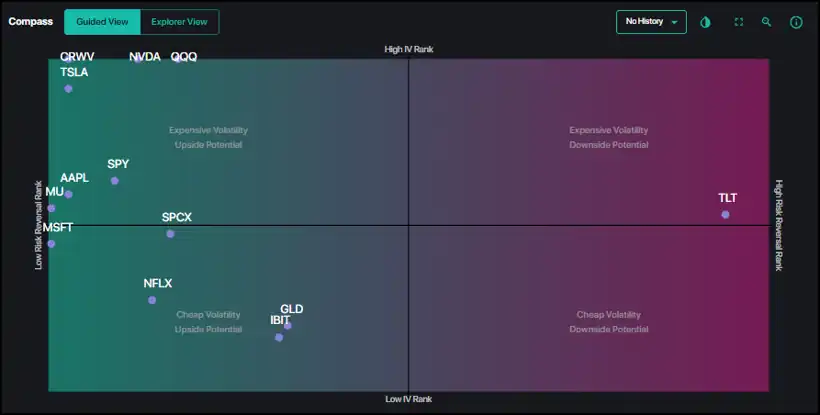
Another important story rests with CoreWeave (CRWV), which faced back-to-back 10% drops on Wednesday and Thursday. CRWV currently holds 99th-percentile IV Rank, with very heavy put skew.
Neocloud stocks like CRWV have been caught in a reflexive selling loop, and the stock reports earnings Tuesday (November 10) post-close. Broader tech may struggle to rally until that group stabilizes.
The remaining AI infrastructure earnings will also test whether last week’s selloff went too far. Nebius (NBIS) and Applied Materials (AMAT) report Thursday, offering a further read on AI infrastructure demand.
We encourage single stock traders to keep an eye on the volatility complex, particularly for those trading shorter-dated options: high IV can attract premium sellers, but these violent shakedowns can quickly become a force to be reckoned with. Similarly, high premium presents a challenge for long-volatility strategies — urging caution for those looking to capitalize on further movement ahead.