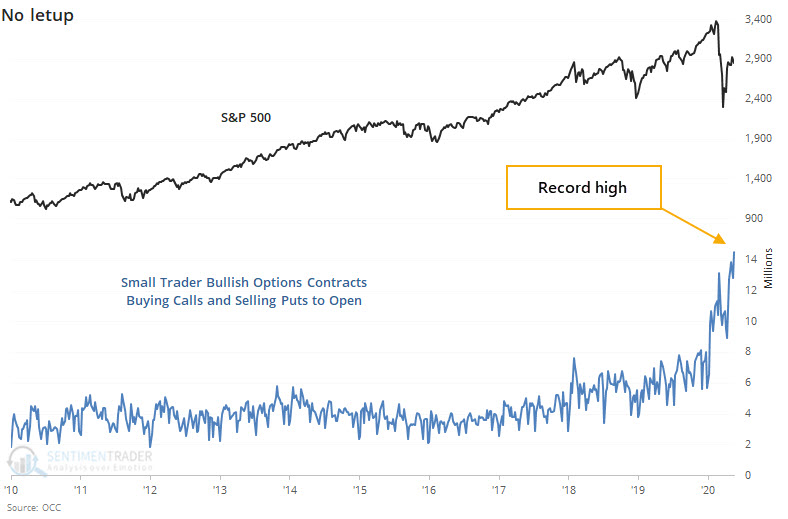
@SentimentTrader posted this chart showing record “small” positions in long calls and short puts. Sentiment says these are “10 contracts or fewer per trade”, insinuating retail traders. This type of trade (long call/short put) is a position also known as a risk reversal. While the traders are not likely actually trading short puts and long calls together, the “retail” positioning is aggregate has a risk profile that is similar to long stock.
If these contracts go in the money and/or create a significant amount of hedging delta, this can create turning points in the market (see here). We had record call positioning in February (market top) and then massive amounts of deep in the money puts for March expiration (market bottom). We think these are turning points because when contracts expire all of the futures that hedge these options must be unwound.
Theoretically when investors buy calls, that makes dealers/market makers (MM) short calls. MM’s then must hedge buy buying futures. When those same investors sell puts, that makes MM’s long puts. Again, they’ll hedge with long futures. Recall above this retail position is essentially “long stock” making MM’s “short stock”. This also means that (at least in SPY) the higher the market goes the more futures dealers need to buy. Knowing at which strike these contracts are positioned, along with when they expire may help prepare you for significant movement.
Open Interest & Options Gamma Levels
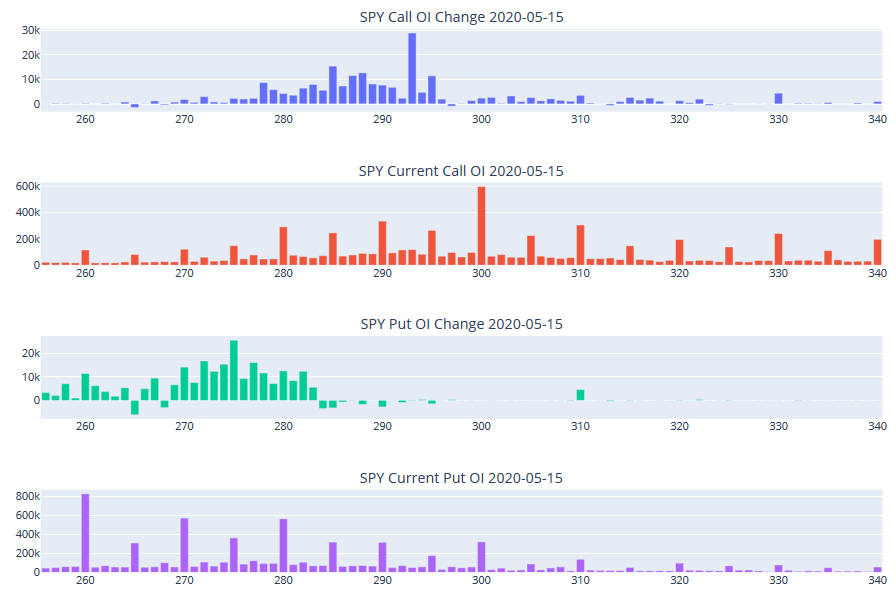
The chart below (available to subscribers) shows where all of the open interest is for SPY. We’d mention that SPX has a similar position profile. Of note was a recent spike up in 300 strike call volume. The 300 strike also has about 600k contracts (red chart).
We also had a fair amount of activity at the 275 strike puts, but you can see (purple chart) there are several put strikes with ~600k contracts.
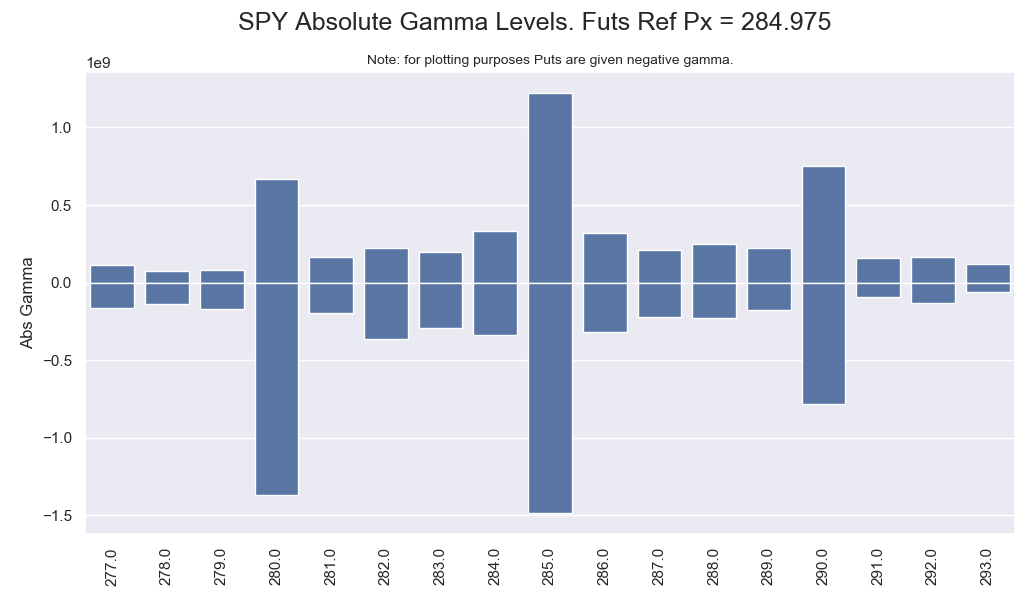
It can be helpful to look at this from a gamma perspective because gamma can help give “weight” to the open interest. This is because at the money contracts require more gamma hedging than far out of the money contracts. The chart below depicts calls with positive gamma and puts with negative gamma, just for ease of display (normally long options have positive gamma, short options negative gamma). You can see that (not surprisingly) 285 has the most gamma, but that there is a sharp drop both >290 and <280. If we were to rally toward the 300 strike a long of positive gamma would kick in (if there are in fact substantial long calls there) and could bring some type of “blow-off” top similar to February.
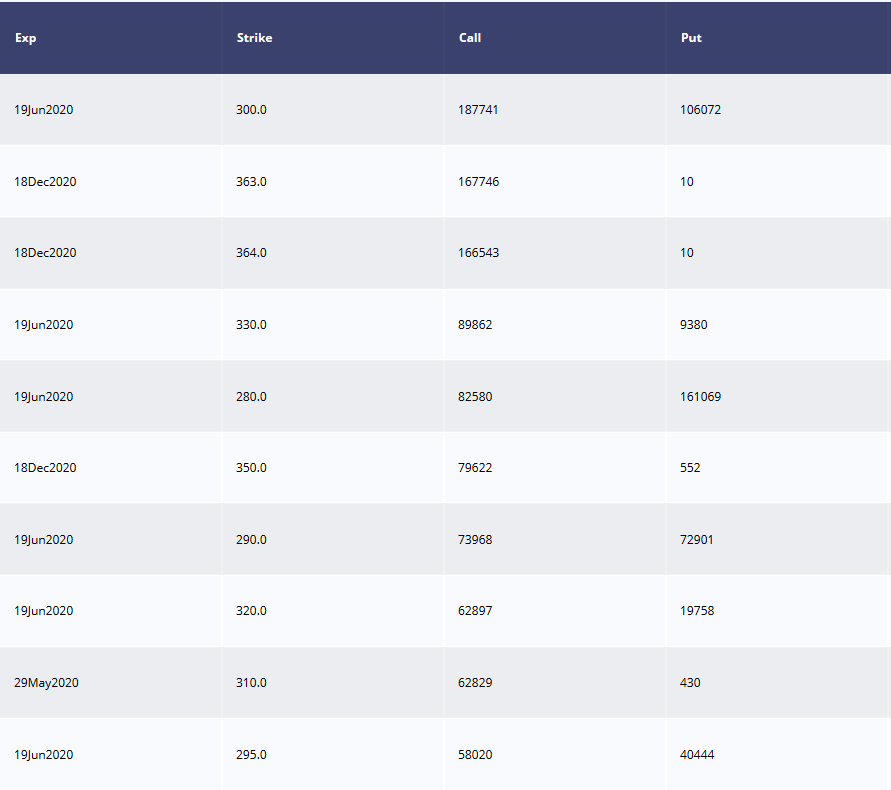
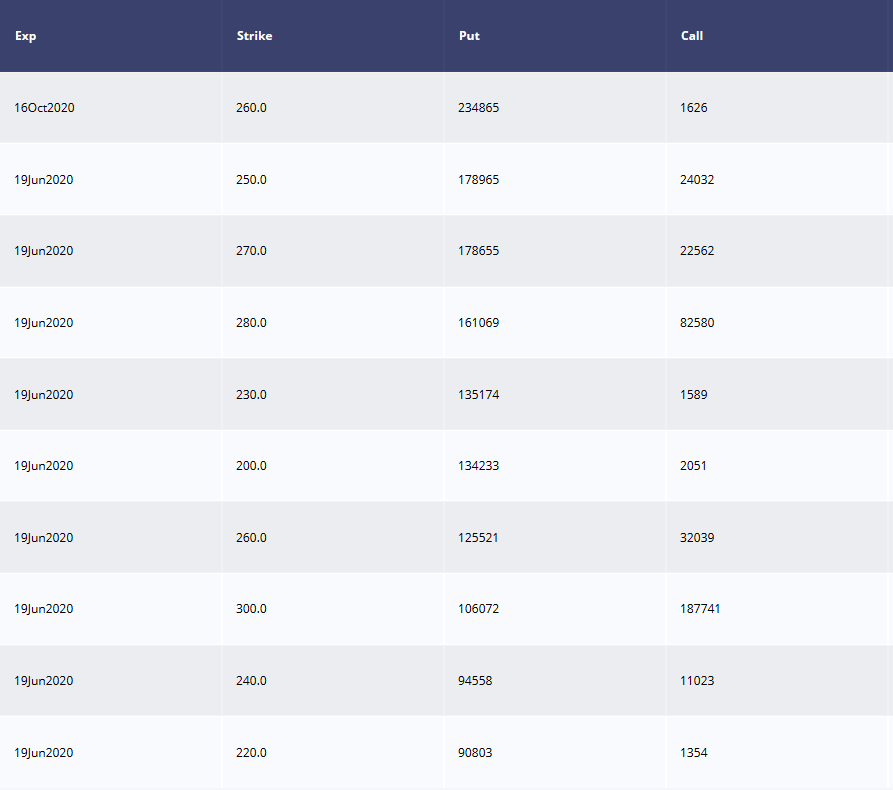
The tables below show the largest strikes for a given expiration (call table top, put table bottom). A very large amount of this open interest in set for June expiration (19th). You can see again the size at 300 for June calls. On the put side a break under 280 starts to give more “gamma weight” to sizeable put positions at 270.
Volatility Ahead
If the market should continue to rally into June and these positions are all closed/expire, that may create the need for dealers to unload long hedges after June expiration. This situation could be avoided if the positions are closed/rolled over the next several weeks, or the market doesn’t rally.
Should the market sell off this positions actually increases positive gamma for dealers, which may suppress volatility. If retail is short a lot of downside puts, this makes dealers long gamma as the market moves lower. This infers they would be buying back futures as the market moves lower, possibly padding a drop. Initially some of this positive gamma would be offset by the decline in 300 strike call values.
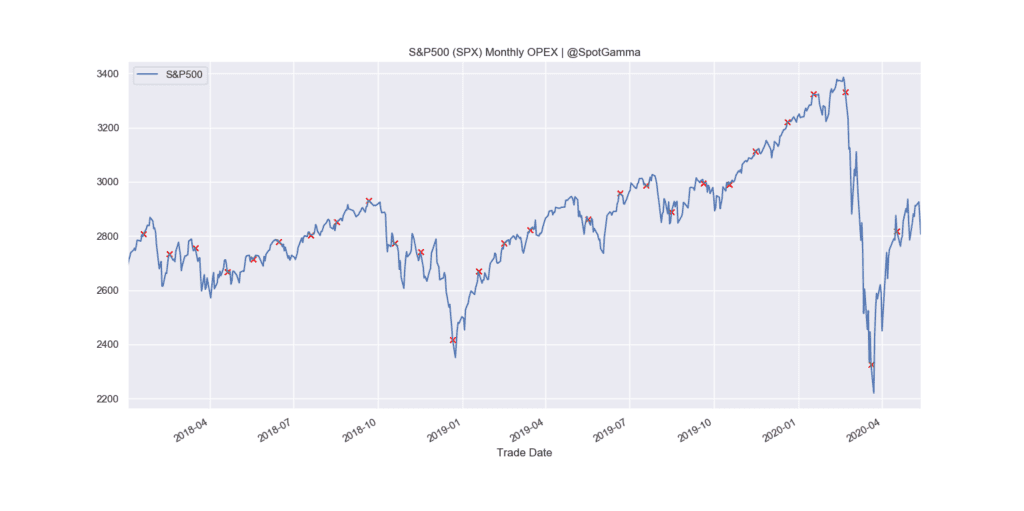
Obviously these positions need to be figured in with the larger SPY/SPX complex including ES and VIX. Regardless of how retail and MM’s are positioned there is a substantial amount of expiration in June, and closing those contracts could mark a turning point for markets. As you can see in the chart below options expiration can market important turns in the market.