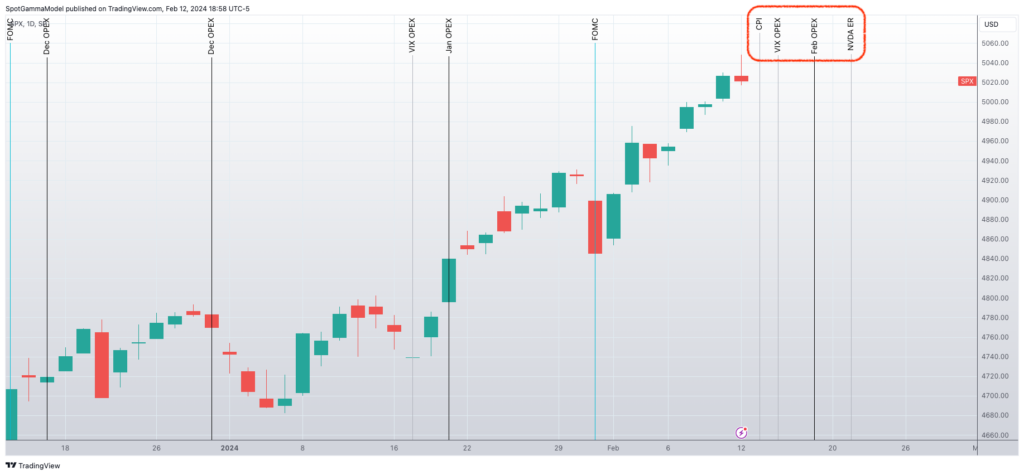
With equities surging higher, the signs of rampant bullishness are percolating. Year-to-date, broad based equity indexes, like the S&P500, are +5.8%, while leading sectors like the SMH (Van Eck Semi ETF) have surged an eye-watering +17.8%.
But, how do you know when the bullishness has gone from a “strong trend” to “exuberance”?
For that, we turn to the options market, wherein we can measure shifts and changes in future (implied) volatility estimates and options prices to draw out statistical measures of demand.
Here, we are going to focus on the concept of skew. Skew describes, for a given stock, the variation in implied volatility across options with different strike prices but the same expiration date.
Fo example, if calls expiring in 1-month have an elevated IV compared to an equivalent downside put, we denote this as an elevated call skew. Higher call skews imply that there is a lot of demand for calls, as the high IV’s could be the result of traders bullish expectations.
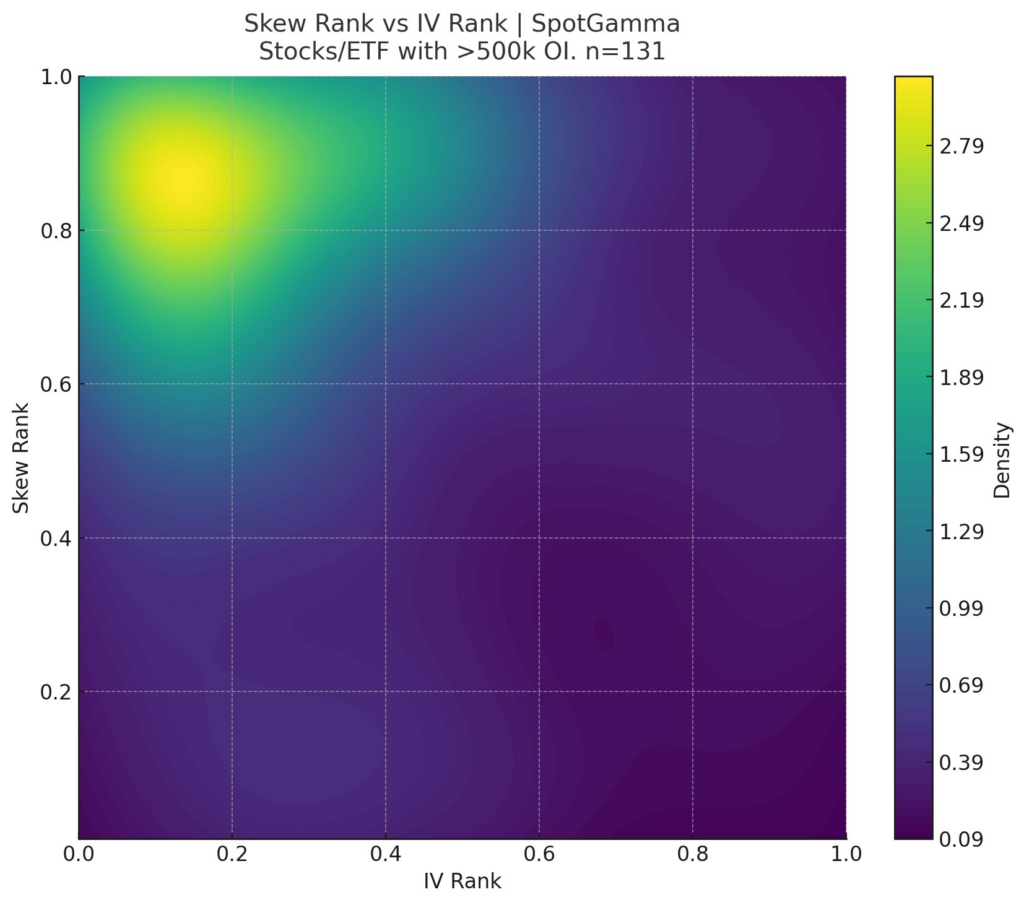
In the plot below we’ve ranked current skew readings for top stocks (%’ile vs the last year), and plotted it on the Y axis. As call IV’s increase relative to puts, the values shift higher in the plot.
The X-axis is “IV Rank”, which measures how high at-the-money (ATM) volatility is for various stocks. Generally, as earnings pass, stocks ATM volatility decreases (moves left on the X axis). In times of high fear, IV increases, which would shift readings to the right on this plot.
As you can see, there is a bright yellow color at the top left of this chart, which informs us that the bulk of stocks measured (the 131 stocks with >500k open interest) have skew readings that are >= 80th percentile readings. This is the result of calls being bid up over puts. Further, because the yellow color is to the left on this chart, we can infer that traders see little risk of a market decline.
Drilling down further, we’ve compiled a list of stocks with top skew ranks. As you can see, many of the Mag 7 (green) & top semi-stocks (yellow) are >=98th %’ile readings! Further, major ETF’s like SPY, QQQ and IWM (blue) are >=90th %’ile.
This objectively informs us that calls have reached peak relative levels of valuation. Said another way: the bullish tech trade is very crowded.

Let’s drill down even further to NVDA, which is the darling of the equity market, and now the 3rd largest stock in the S&P500. It reports earnings on 2/21, with the stock up nearly 50% since Jan 1.
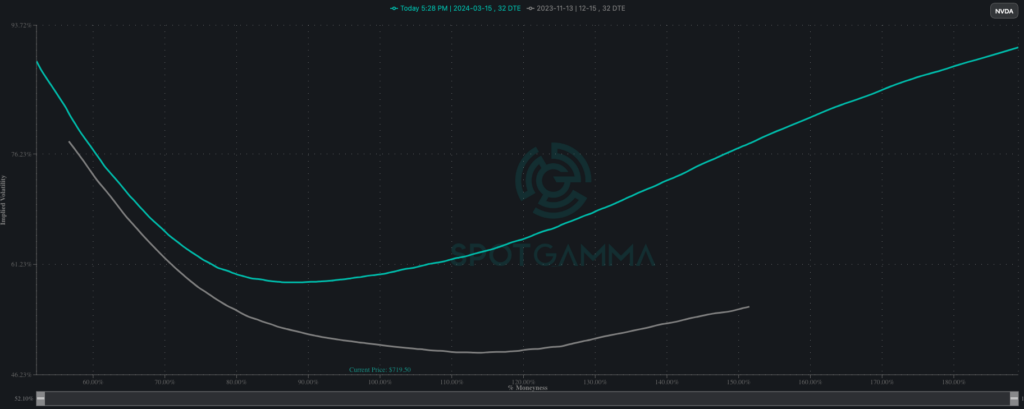
As a result of the stocks tremendous move, and traders bullish anticipations, skew, plotted here for 1-month options (green line), is extremely elevated. We call this a “heavy” call skew because out-of-the-money calls have a higher IV than ATM options, or even relative downside puts.
You get a further sense for how extreme current readings are when you compare them to 1-month skew, from just before their most recent earnings (November ’23, gray line). As you can see IV is now both much higher (the green line raised over the gray line), but there also a much larger call skew (higher strikes now have much higher relative IV’s).
With this type of skew we think its hard for NVDA’s earnings to beat traders bulled up expectations. It’s not that NVDA’s actual earnings results can top expectations, its that the stocks price reaction may have a hard time overcoming the exuberant price expectations.
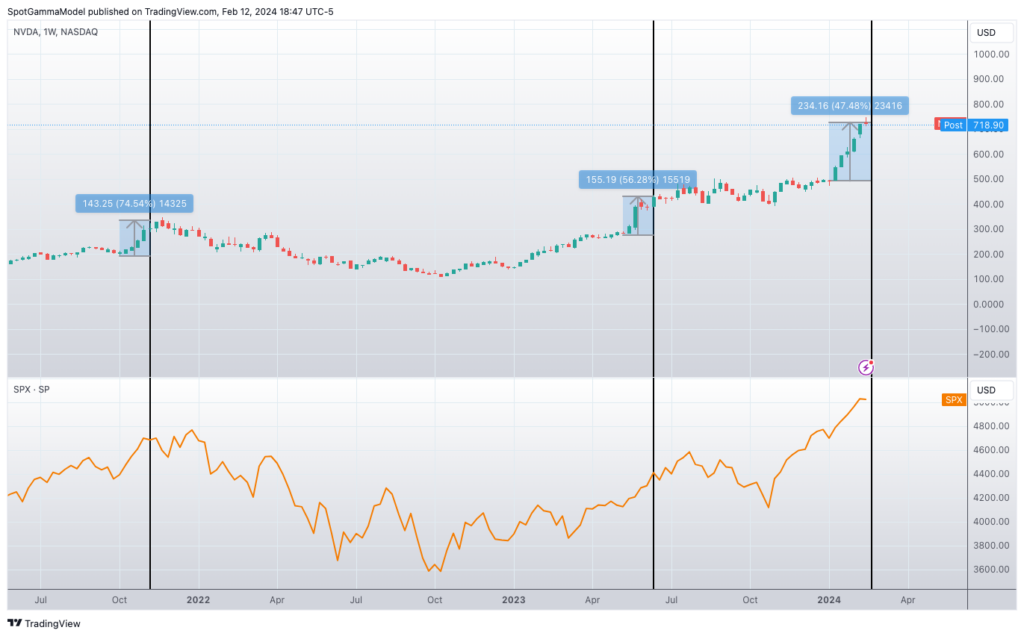
We’ve seen two other times in recent history when NVDA skew was as elevated to current readings: into NVDA earnings on Nov ’21 & June ’23 (black lines). As you can see, into both earnings dates the stock saw incredible returns, and then after earnings, the momentum stalled.
As with those prior periods, we now see the stock markedly higher into upcoming 2/21/24 earnings, with similarly rich call IV’s/prices.
Interestingly there were not major, immediate reversals for NVDA after these earnings, but those dates marked the final stages of broader market rallies (SPX, bottom plot).
Under the hood, heavy long call demand creates a negative gamma positional environment. This infers that dealers, who are selling calls, likely need to hedge by buying stocks as stocks go higher. This creates a reflexive feedback loop: higher stocks draw more long call demand which draws more hedge-buying from dealers.
However, there is a possible moment to break this feedback loop over the next week. Tomorrow (2/13) is the CPI report, followed by 2/14 VIX expiration & 2/16 options expiration. Should CPI come in hotter than expected, it could pull out some of this excess call demand, resulting in dealers needing to unwind long stock hedges.
Further, the VIX + equity options expiration will likely serve to reduce many of the options positions which are supporting the rapid rise in equity prices. We believe the removal of these positions will lead to a correction in stocks, with the S&P500 testing the 4,900 level.
Should that 4,900 level break, we would look for a longer, more protracted selloff, wherein volatility escalates significantly.