Evaluating IBIT with Positional Analysis
Crypto markets have faced serious selling pressure this past month, and last Friday’s sharp decline pushed Bitcoin to yearly lows near $80K. BTC is now on track for its worst monthly performance since 2022—down 22% over the past month and negative for the year. Using Positional Analysis, we can examine hedging pressure, implied volatility, and volatility skew to help understand how IBIT is positioned — and where it may be heading next.
This intense selloff has raised concerns about forced liquidations, margin stress, and whether these crypto-specific dynamics might spill over into broader risk-off sentiment. Last week, IBIT (Bitcoin ETF) saw massive options activity throughout the selloff, with daily volume running between 1–2 million contracts. This surge in trading activity provides a clear window into how traders are positioned for volatility and how dealers may have been forced to hedge into the move.
Analyzing IBIT Volatility and Skew
The risk-off move in Bitcoin pushed both implied volatility (IV) and skew noticeably higher. As shown in the IBIT Volatility Skew data, put IV is now trading above IBIT’s peak call IV reached on 6 October 2025—when Bitcoin peaked at $126K.
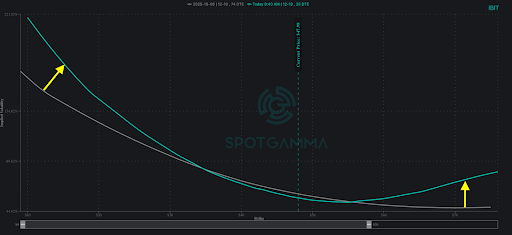
Both puts and calls now sit well above their 90-day statistical average prices, but the divergence is what stands out: put skew has blown out far beyond the 90th percentile, reflecting intense demand for downside protection. Call skew is elevated, but not to the same extent. This is consistent with an asset that has fallen 22% over the past month.
IBIT put IV is extremely rich—so rich, in fact, that even if the underlying continues to drop, the puts you own may not increase in value proportionally because IV may already be near saturation.
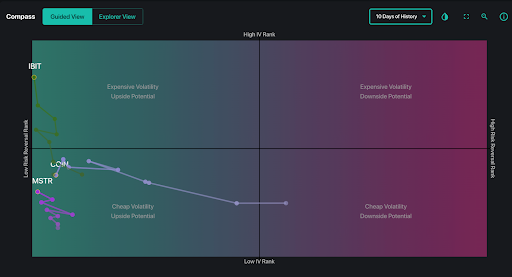
Comparisons with COIN and MSTR reveal the same pattern: elevated implied volatility across Bitcoin proxies makes it expensive for traders trying to position for a bounce.
Key Levels: 49 Support and 52–55 Resistance
With traders buying protective puts and skew near historical extremes, the question becomes: has IBIT found an interim low? Positional analysis of IBIT reveals structural support and resistance that is worth paying attention to.
Support: $49 Forms Support
Traders have been loading up on puts at the $49 level, leaving dealers short puts into that strike. This price can cause a local “vacuum effect” where price tends to accelerate towards the strike, and can also make it somewhat challenging to break below.
It’s important to note that IBIT is facing a negative gamma regime, as per our Synthetic Open Interest model. When price increases, dealers must hedge by buying the underlying stock, while a price decrease means dealers must hedge by selling stock. This can amplify the amount of movement we would normally see.
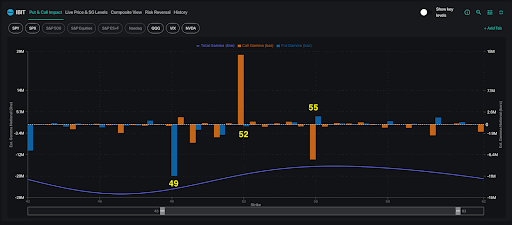
Resistance: $52 Call Wall and $55 level
At IBIT $52, traders are generally short calls, leaving dealers long calls. A move above $52 forces these dealers to sell stock, which creates mechanical resistance. Given that traders are short $55 calls, a decisive break above could amplify upside momentum towards this strike.
Together, these levels outline a tight corridor of hedging-driven flows likely to influence near-term trading.
IBIT Unusual Options Flow
Recent IBIT order flow has been notably directional, revealing how traders are positioning around both short-term volatility and longer-term recovery potential. One of the most prominent trades was a bearish risk reversal, where 61,000 December 43 puts were bought to open while 52 calls were sold to open.

This structure reflects heightened downside concern and reinforces the persistent demand for put skew. At the same time, there was also clear evidence of dip-buying interest in longer-dated options, highlighted by 22,000 March 26 $65 calls bought to open—suggesting investors are still willing to position for a rebound over a multi-month horizon.
Finally, elevated implied volatility led some traders to pursue premium-harvesting strategies, including selling 19,000 December 5th $54 calls to open, capitalizing on rich option premiums.
Taken together, this mix of flows implies that while short-term volatility may cool off following recent extreme hedging activity, long-term implied volatility is likely to remain elevated. The options market continues to price in meaningful uncertainty through February, even as near-term pressures show signs of moderating.
Looking Forward: Two Paths Ahead for IBIT
The combination of extreme downside skew, elevated implied volatility, and IBIT trading near a key positional support zone paints a fragile picture. The options market is signaling stress, and stabilization will require both price support and a normalization of the volatility surface.
From a positional and volatility perspective, IBIT now sits at a clear inflection point, with the options market signaling two potential paths. On one hand, the volatility surface could begin to mean-revert, allowing put skew to cool, hedging pressure to ease, and IBIT to stabilize above the key $49 support, ultimately pulling implied volatility back toward more “normal” levels.
On the other hand, persistent hedging pressure could drive further downside if put skew remains historically elevated, forcing dealers to continue selling into declines and potentially pushing IBIT through the critical $49 level, which would reinforce a more sustained bearish move.
Traders should watch two data points closely: whether put skew stays unusually steep, and whether IBIT decisively breaks below $49. At this stage, neither outcome dominates; the options market is pricing both as viable, and the next move will likely hinge on how long this extreme skew environment persists.
Want These Insights Ahead of Each Trading Day?
SpotGamma provides both pre-market insights and real-time analytics designed to help you optimize your trades and protect your PnL. This week only, get 75% off your first month of SpotGamma Alpha — only available for a limited time.
