Macro Theme: |
Key Levels: | ||||||||||||||||||||||||||||||||||||||||||||||||||||||||||||||||||||||||||||||||||||||||||||||||||||||||||||||||||||||||||||||
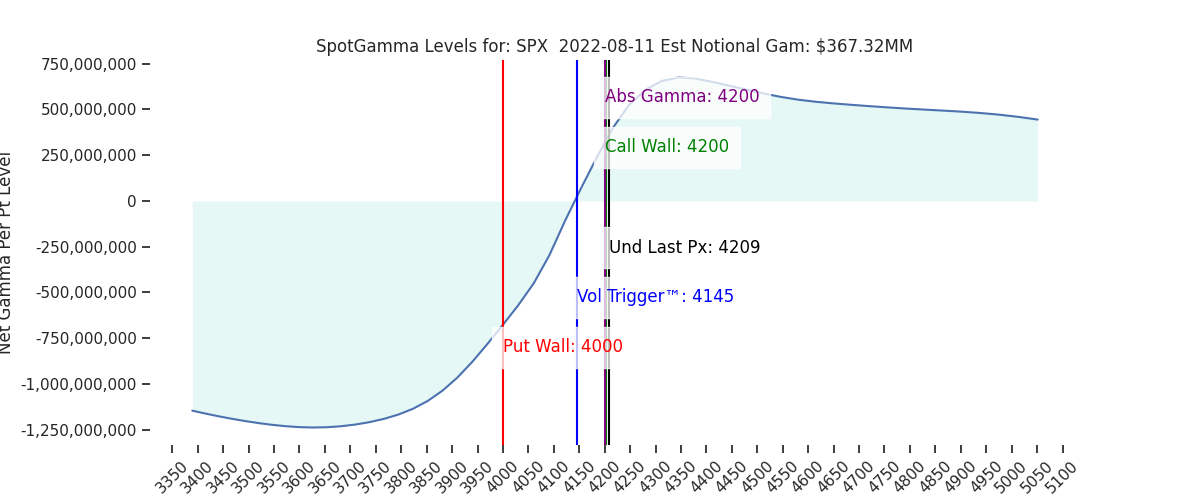
| Market Context: – Markets appear to be in a positive gamma cycle, with call positions building slowly. This should work to reduce volatility and support markets into August OPEX. S&P 500 Levels: – $4,200 Resistance (Top Of Range) – $4,150 Key Pivot (Middle Of Range) – $4,100 Support (Bottom Of Range) What To Watch: – Expecting little change in our positive gamma stance into the monthly options expiration (OPEX). – A break of ~$4,100 Volatility Trigger increases the potential for an accelerated sell-off. – Watch 1-month realized volatility (ref: 19, 8/2/22) as a baseline for IV (i.e. VIX). If RVOL continues to decline it implies IV can drag lower, which is a market tailwind. | Daily Note:
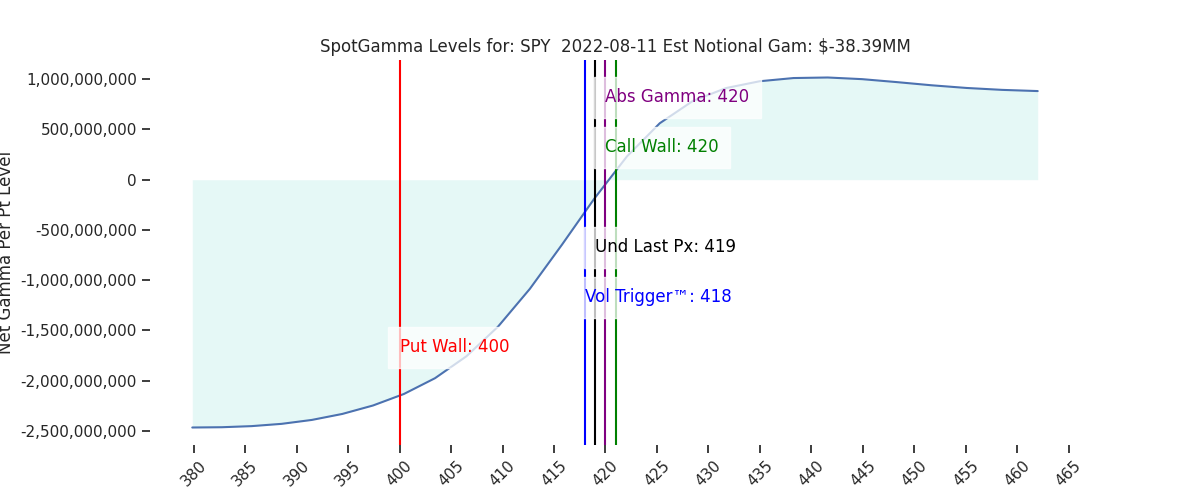
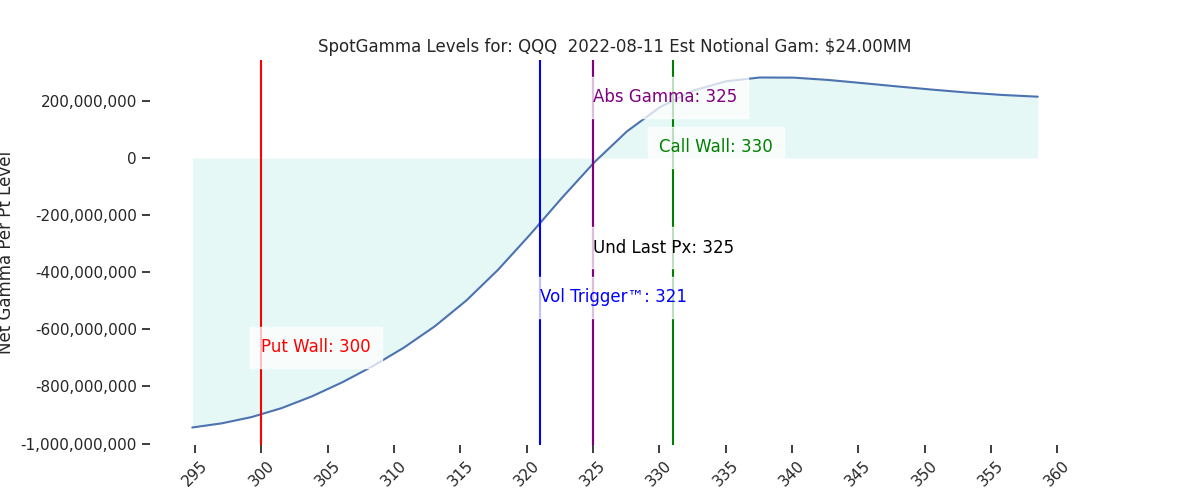
Futures are higher to 4220. As the Call Walls did not roll higher, we consider moves >4200 as overbought. We have two resistance levels above: 4226 & 4247. Support shows at 4210 (SPY 420) to 4200. Beneath there support is at 4150 (Vol Trigger). We were rather surprised to see the Call Wall did not roll higher for SPX/SPY. It did rise for the QQQ (330 v 325). The volume at 420/4200 yesterday was intense (200k SPX, >1mm SPY), and the SPX pinned that level after a large 50pt gap open. There were some small additions to both 4250 & 4300 call strikes, just not enough to roll our Wall higher. What this leaves us with is 4200 being now the largest gamma strike (AGS) which makes it a large support line, but because it remains the Call Wall our models look for a pinning of this area. The idea is that calls need to build up at strikes >4200 to help stabilize and/or draw markets higher. With this move, we’d expect IV ie VIX to take another leg lower. 1% intraday moves have been standard, but now our vanna model (below) is showing that dealers will be selling into strength and buying dips as IV declines and/or markets increase (more on this concept from a recent note here). This is implied by the skew of the model which shows dealer options deltas increasing as markets go higher and IV comes down. This suggests dealers need to short more as markets goes up, and buy those futures back as the market goes down. In other words: we favor mean reversion in this market, as opposed to significant directional changes. 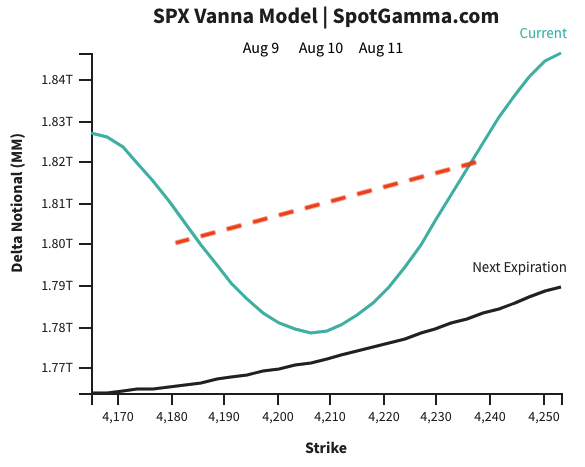 Finally, we wanted to share a bit of data we’ve monitoring. Recently we made the comment that gamma (and stability) seems slower to build because a lot of the volume/OI is concentrated in short dated options. For SPY alone we found that typically >60% of daily volume is in contracts with <5 DTE. However, only ~15% of open interest sits at those short dated contracts. Further, we’ve plotted the SPY options volume/open interest for <5 DTE contracts. As you can see there is now a strong trend of short dated volumes being ~200% of open interest. In other words, this is “day trading” and not actual positions. 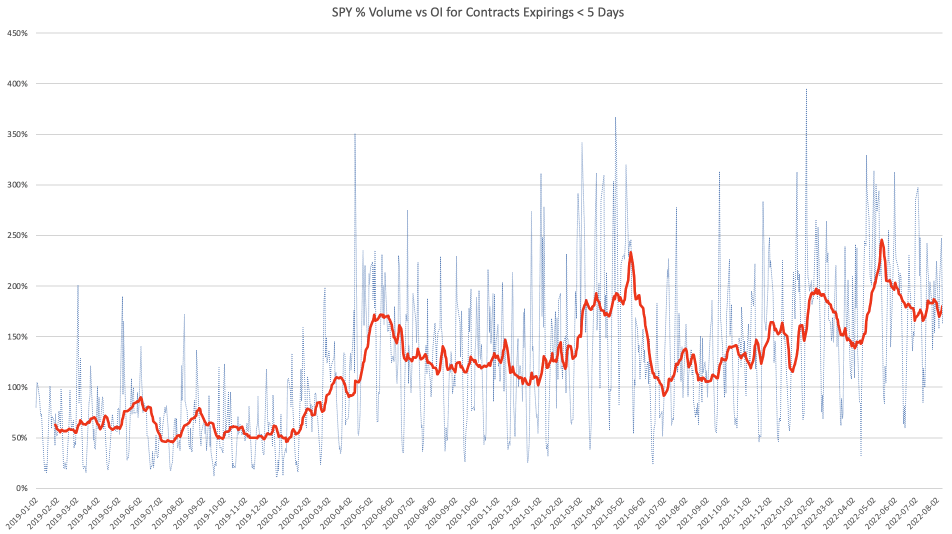 A more complete report on this is in the works, but initially this suggests that markets prices will generally remain more frenetic as the short dated positions move much more frequently. It may also imply more jump risk in markets as day trading volumes pile on to intraday trends.
New Arrivals
an important announcement for a greater purpose
Amidst the chaos, unveil what truly drives today's markets. Synthetic OI + Compass give you the best lens to understand options and volatility - get 50% OFF your first year of an Alpha subscription, offer ending today.

TrendSpider + SpotGamma
Last Chance: Get 50% OFF SpotGamma Alpha
|