The FOMC Can Send the Market to 3580 in Ten Days
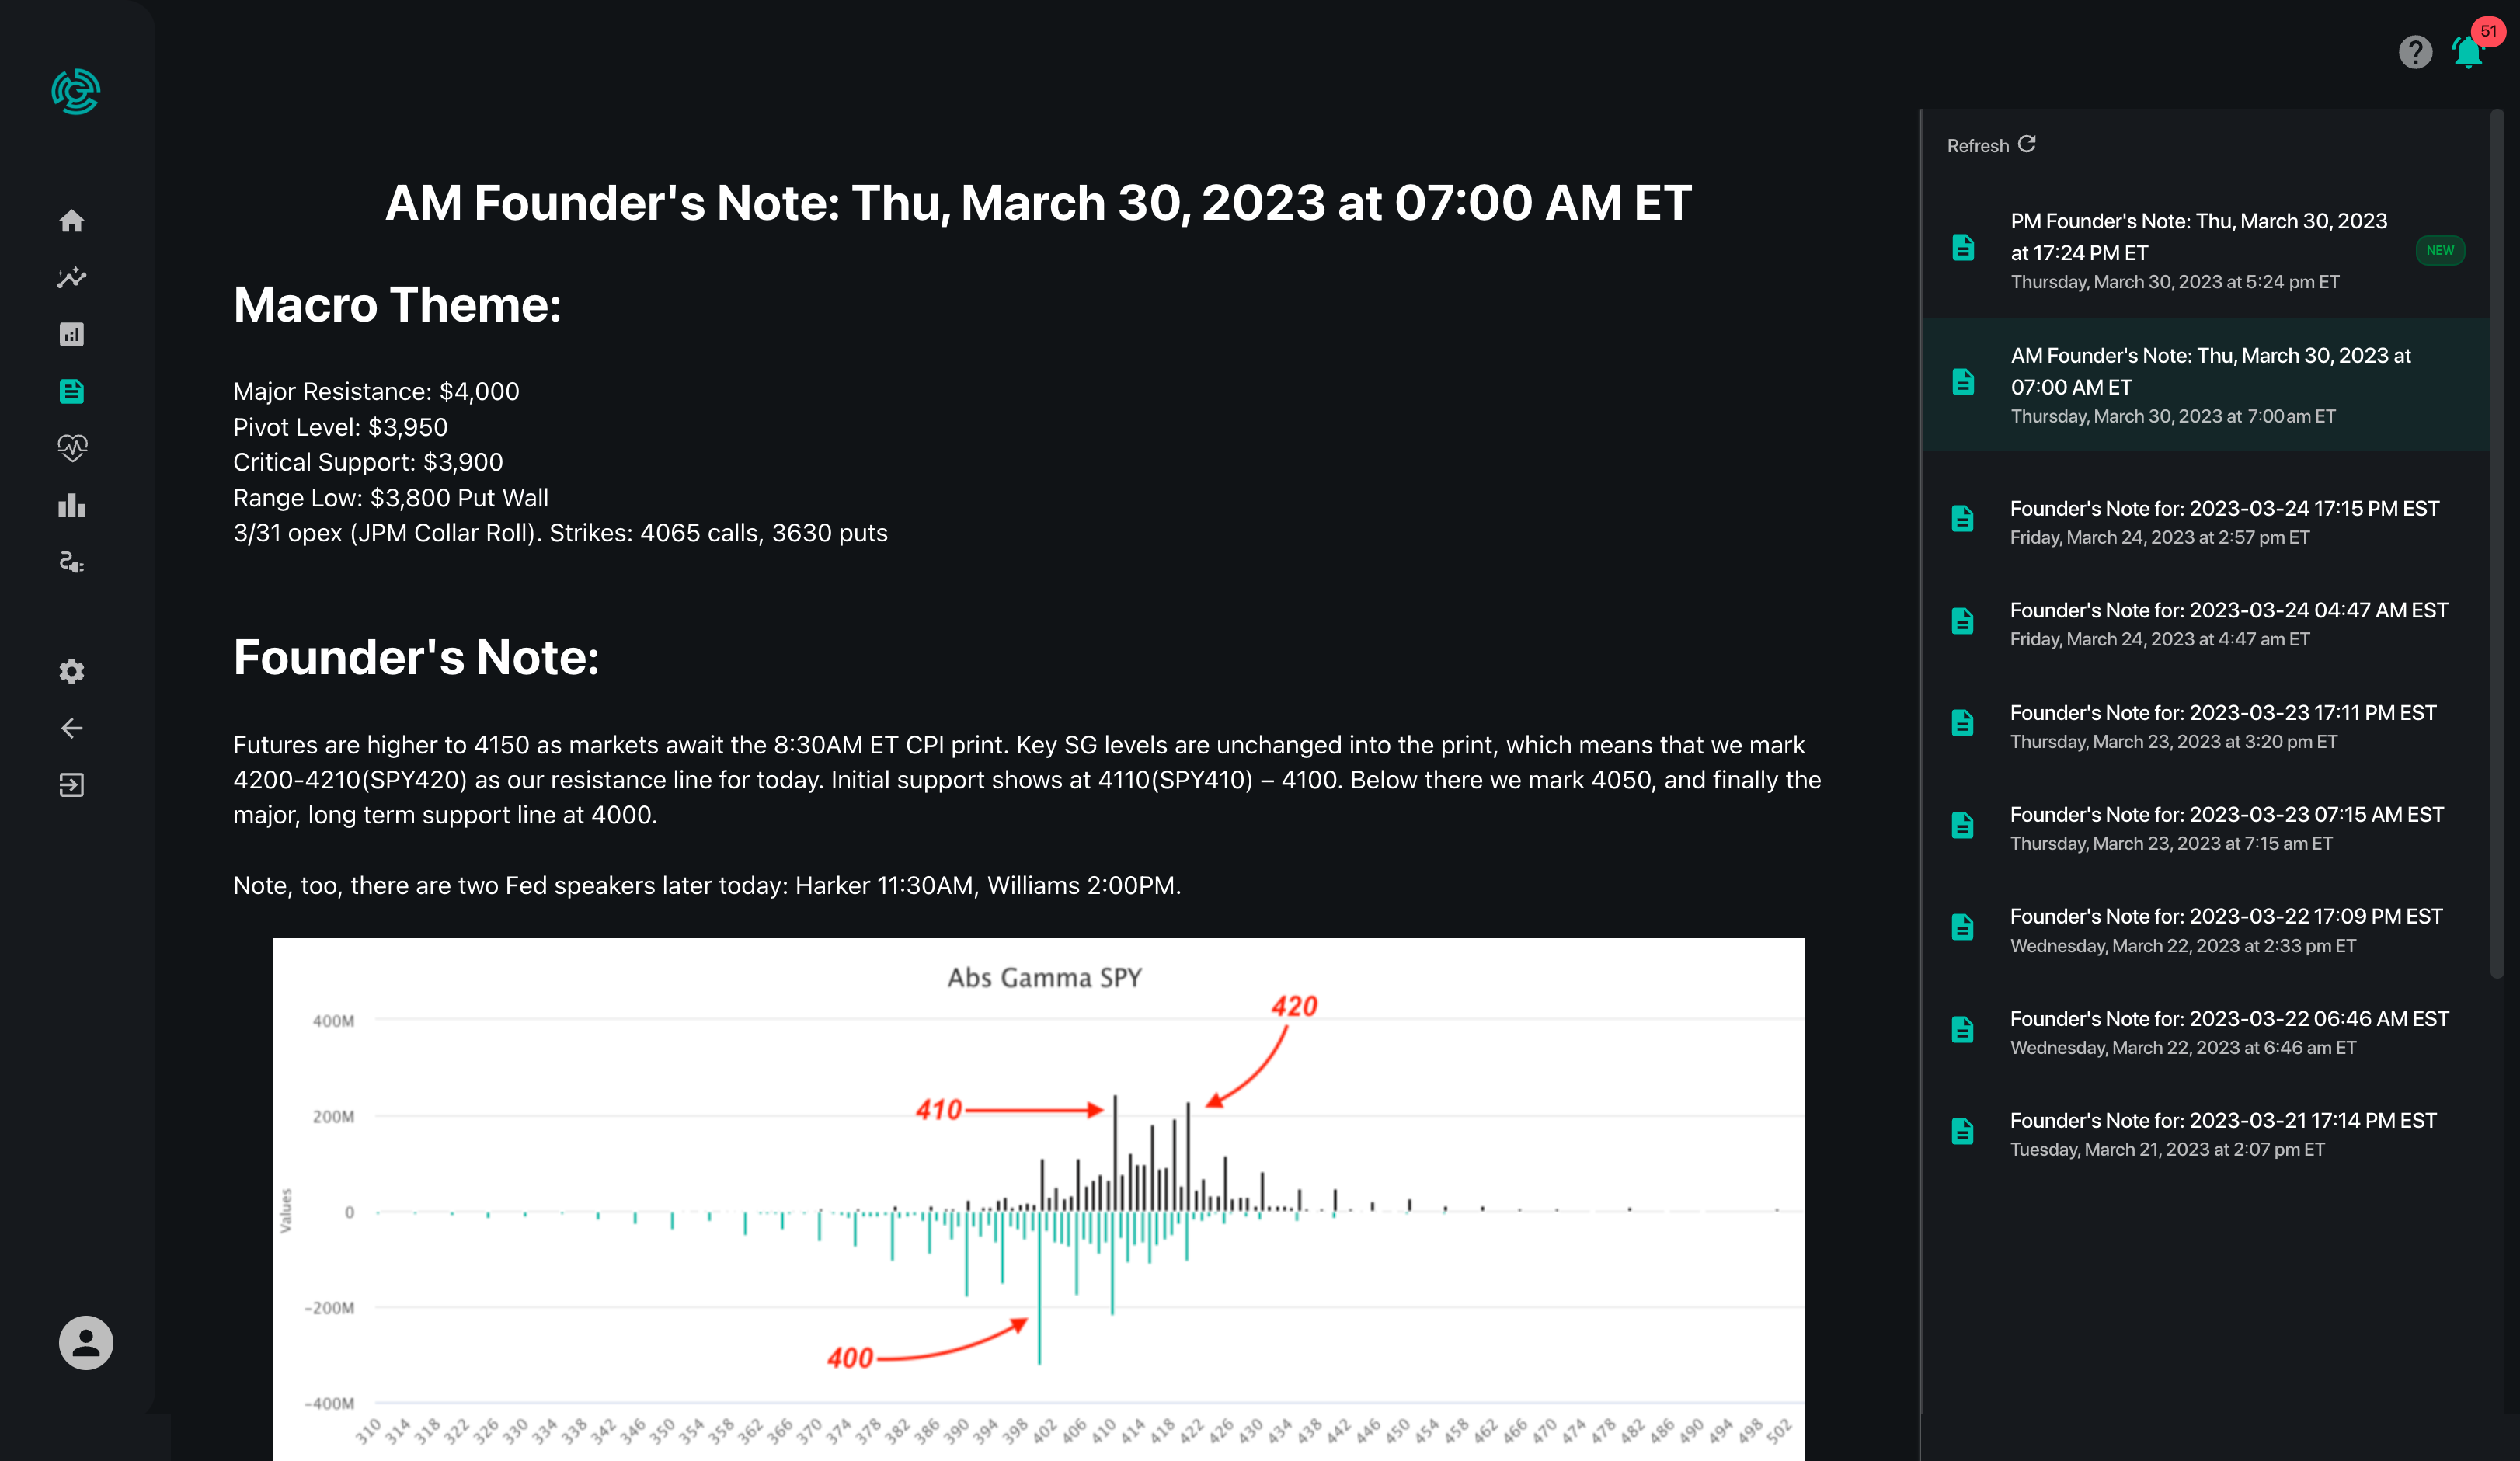
Macro Theme: |
Key Levels: |
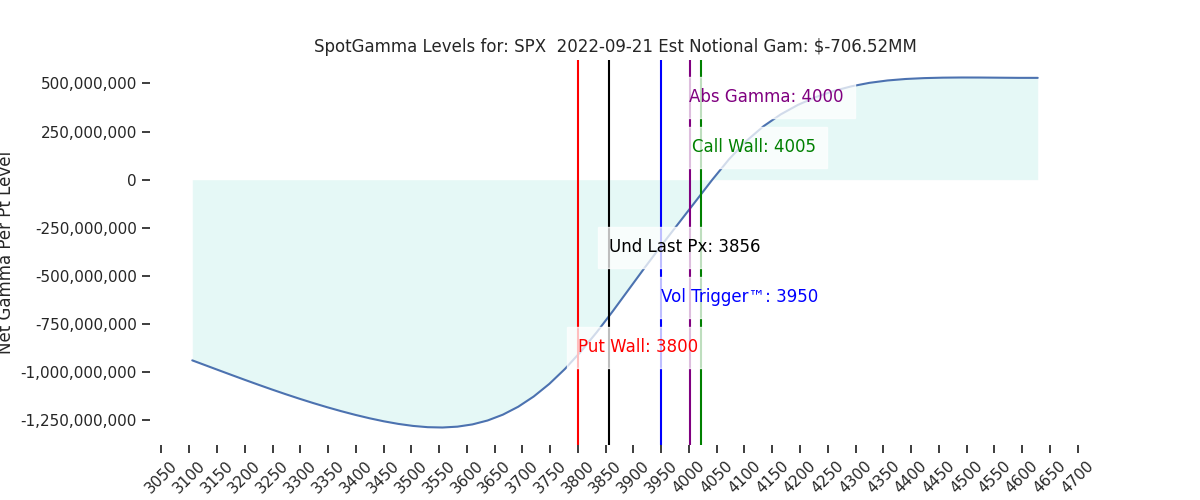
| –> 4005 SPX Call Wall is the top of our range –> 3800 Put Wall is at the bottom of our range –> We assign a bearish edge to markets as long as the SPX is < Vol Trigger (3950) –> 9/21 FOMC/VIXexp is a key turning points –> We look for a sustained directional move from 9/21 FOMC into the end of September | Ref Price: 3856 SG Implied 1-Day Move: 1.23% SG Implied 5-Day Move: 2.9% Volatility Trigger: 3950 Absolute Gamma Strike: 4000 Call Wall: 4005 Put Wall: 3800 |
Daily Note:
Futures are flat head of todays 2PM ET FOMC. Resistance shows at 3900 then 3920. Support shows at 3849 and 3814. The 4005 Call Wall is our major overhead target into end of week. On a larger time frame we highlight the 3580 area as a major downside level into end of month. This reads as roughly ±150 handles of rapid market movement either way.
The market is favoring a 75bps increase today, and given that outcome traders will be keying off of Powell’s 2:30 ET speech. Again, we see the distribution of outcomes here as fairly even in the near term.
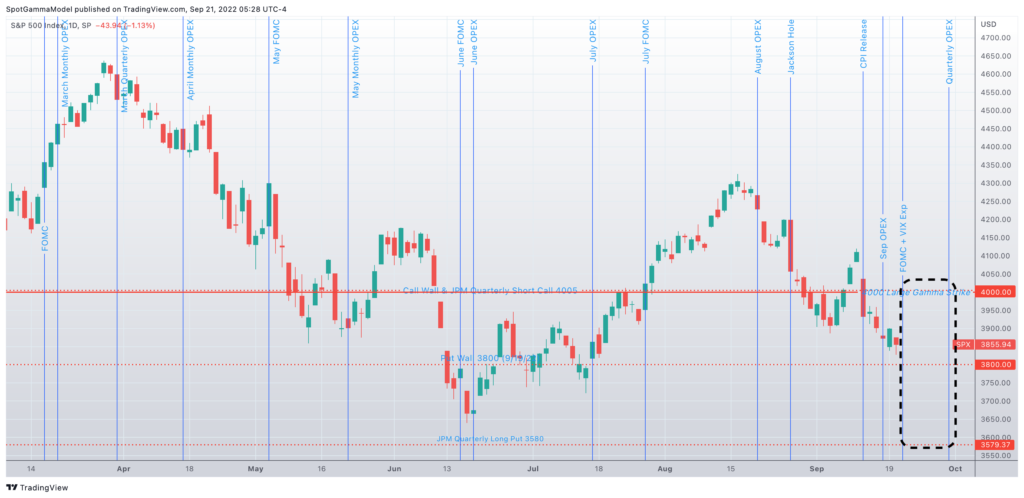
Sep OPEX drained off much of the short term put fuel, and call positions are more-or-less nonexistent out into Dec OPEX. IV remains elevated (as shown yesterday).
This signals to us that if markets are agreeable with the FOMC outcome, there is a small IV kicker to help fuel rallies up into 4000. If call positions do come in with a rally, then we would see it reflected in the Call Wall (i.e. a shifts higher) and we’d would look for rally extensions >4000.
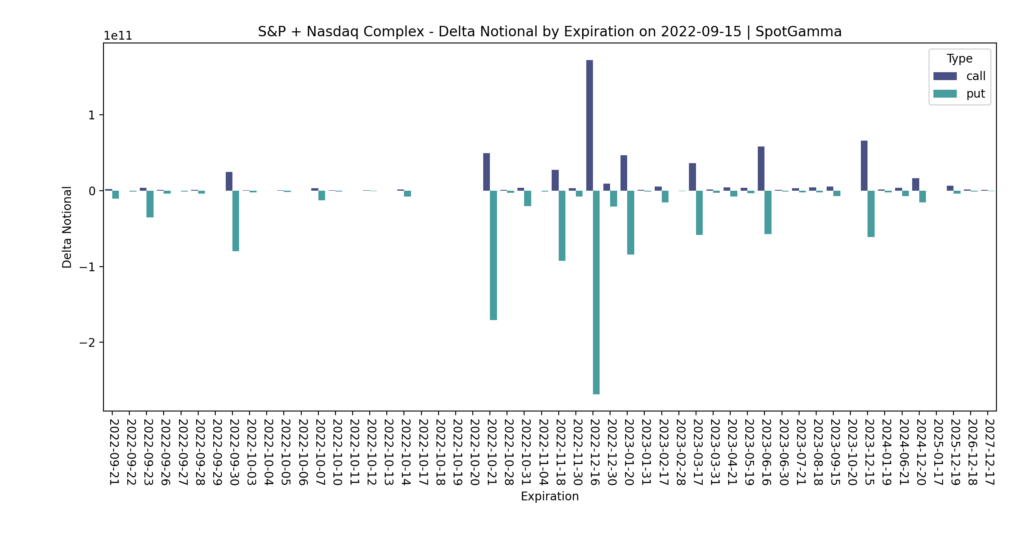
If Powell disappoints, the downside will be met with elevated IV levels which drives put values higher. While there is some size at the Sep 30th quarterly expiration, the larger force is derived from the October and December positions. A spark lower could create (or maintain) this cycle of elevated volatility longer term.
Many of you are familiar with this chart of 1 month realized S&P500 volatility, which is sustained at levels not seen in the past 10 years. When we refer to “elevated longer term volatility”, we see this realized volatility sustaining at these levels.
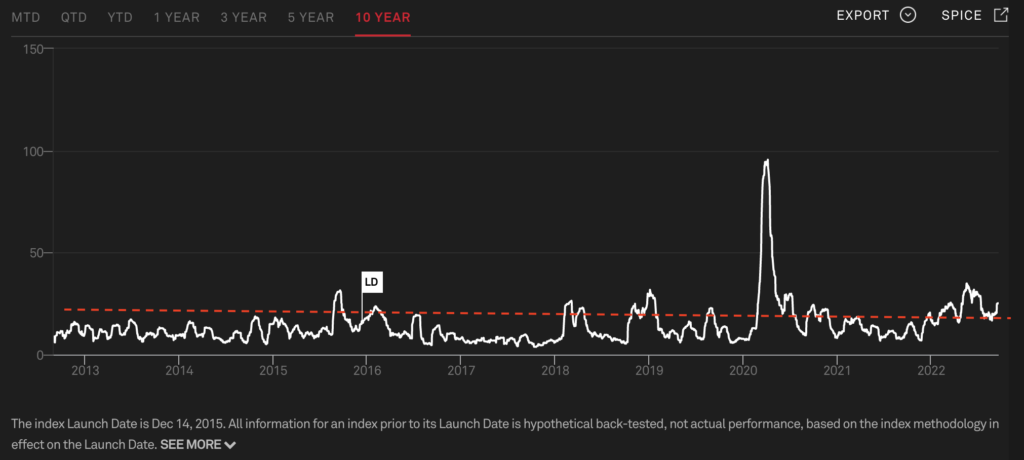
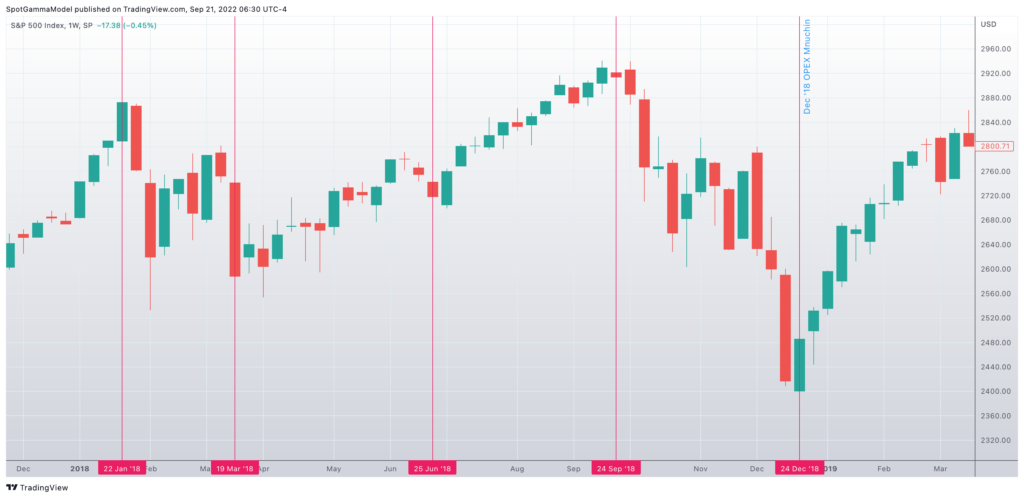
The analogy we draw is to Q4 of 2018. In this case, should Powell keep the pressure on, it will keep volatility levels high. Further we have US elections ahead, which functions to sustain elevated IV levels. While our views generally only extend 30 days, we are confident the December put positions will remain sizeable, and capable of fueling downside energy.
| SpotGamma Proprietary SPX Levels | Latest Data | SPX Previous | SPY | NDX | QQQ |
|---|---|---|---|---|---|
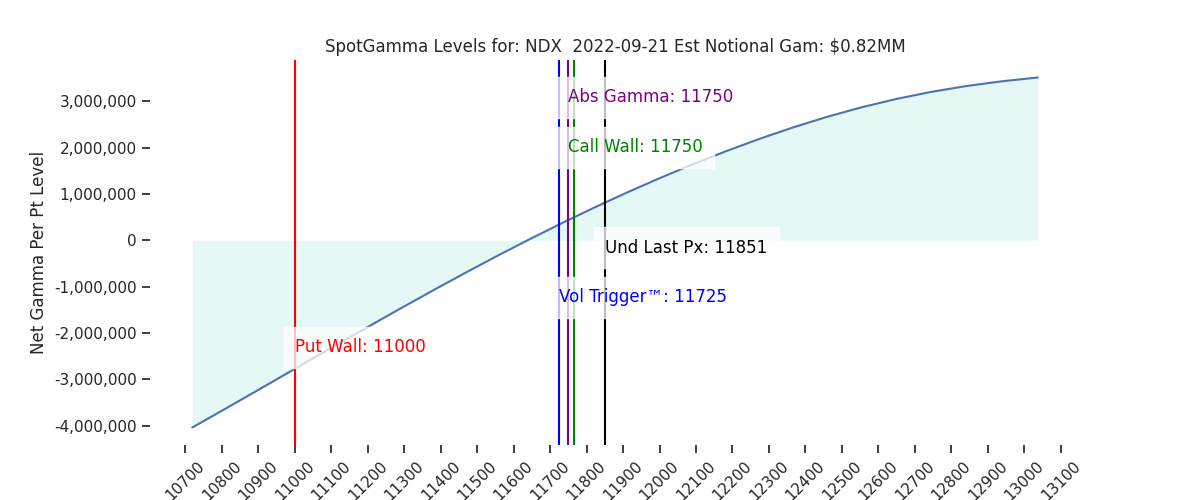
| Ref Price: | 3856 | 3859 | 384 | 11851 | 288 |
| SG Implied 1-Day Move:: | 1.23%, | (±pts): 47.0 | VIX 1 Day Impl. Move:1.72% | ||
| SG Implied 5-Day Move: | 2.9% | 3872 (Monday Ref Price) | Range: 3760.0 | 3985.0 | ||
| SpotGamma Gamma Index™: | -1.29 | -0.94 | -0.39 | 0.01 | -0.14 |
| Volatility Trigger™: | 3950 | 3950 | 400 | 11725 | 300 |
| SpotGamma Absolute Gamma Strike: | 4000 | 4000 | 390 | 11750 | 290 |
| Gamma Notional(MM): | -707.0 | -753.0 | -1978.0 | 1.0 | -933.0 |
| Put Wall: | 3800 | 3800 | 375 | 11000 | 280 |
| Call Wall : | 4005 | 4005 | 430 | 11750 | 315 |
| Additional Key Levels | Latest Data | Previous | SPY | NDX | QQQ |
|---|---|---|---|---|---|
| Zero Gamma Level: | 4058 | 4030 | 407.0 | 11573.0 | 334 |
| CP Gam Tilt: | 0.61 | 0.57 | 0.45 | 1.09 | 0.48 |
| Delta Neutral Px: | 4001 | ||||
| Net Delta(MM): | $1,361,625 | $1,310,755 | $182,946 | $41,827 | $103,141 |
| 25D Risk Reversal | -0.05 | -0.04 | -0.04 | -0.05 | -0.05 |
| Call Volume | 485,023 | 438,050 | 2,842,591 | 4,679 | 835,078 |
| Put Volume | 668,945 | 770,074 | 3,951,567 | 3,905 | 1,064,703 |
| Call Open Interest | 5,322,394 | 5,233,761 | 6,803,095 | 52,381 | 4,103,093 |
| Put Open Interest | 9,307,137 | 9,207,896 | 11,439,559 | 65,039 | 6,754,374 |
| Key Support & Resistance Strikes: |
|---|
| SPX: [4000, 3950, 3900, 3800] |
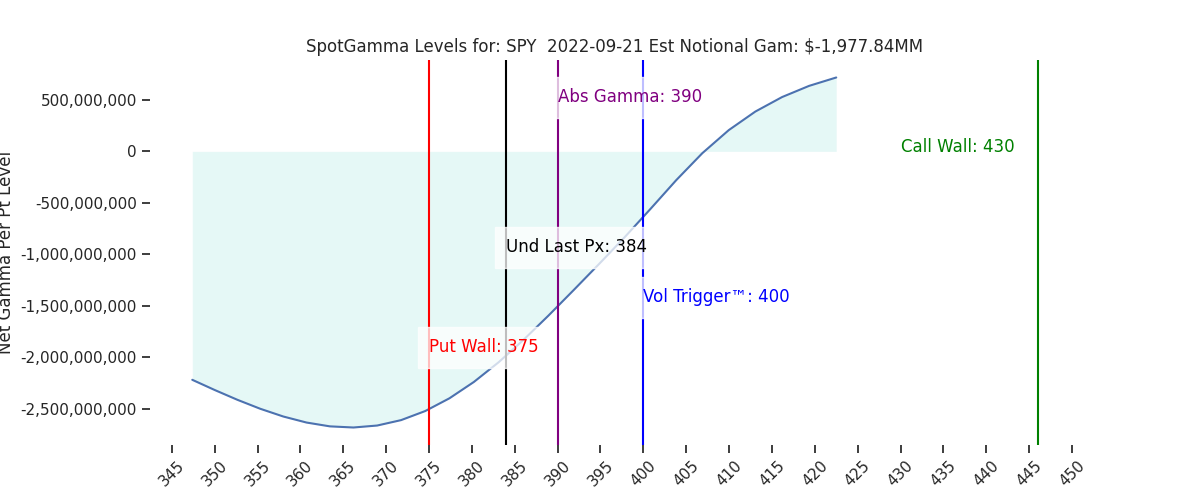
| SPY: [390, 385, 380, 375] |
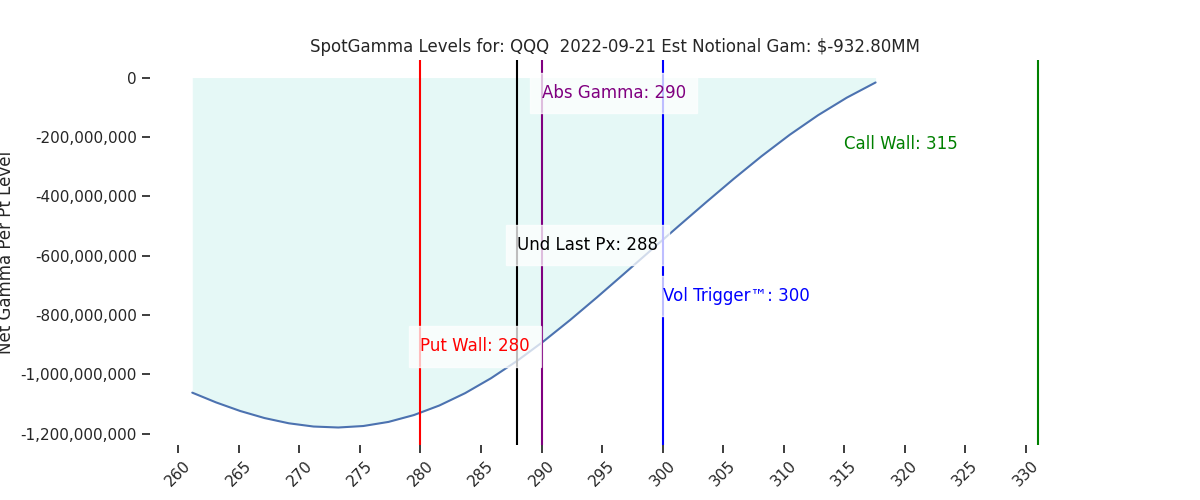
| QQQ: [300, 290, 285, 280] |
| NDX:[13000, 12500, 12000, 11750] |
| SPX Combo (strike, %ile): [(3949.0, 75.78), (3915.0, 77.05), (3899.0, 91.19), (3849.0, 88.35), (3826.0, 73.83), (3814.0, 84.27), (3799.0, 97.65), (3776.0, 85.71), (3764.0, 86.12), (3753.0, 95.42)] |
| SPY Combo: [378.33, 373.72, 388.31, 383.32, 374.87] |
| NDX Combo: [11899.0, 11697.0, 11745.0] |
| ©TenTen Capital LLC d.b.a. SpotGamma Please leave us a review: Click Here |
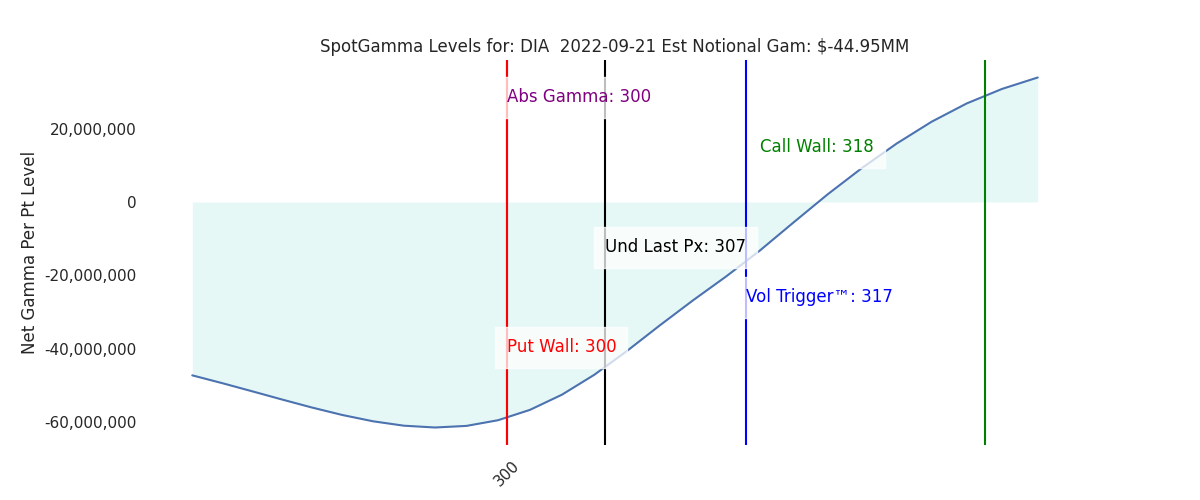
| See the FAQ for more information on reading the SpotGamma graph. |
| SpotGamma provides this information for research purposes only. It is not investment advice. SpotGamma is not qualified to provide investment advice, nor does it guarantee the accuracy of the information provided. This email is intended solely for subscribers, please do not distribute the information without the express written consent of SpotGamma.com. |