big fund buying & selling report
Daily FlowPatrol™ Report
Uncover the flows moving the market
— before they move prices.

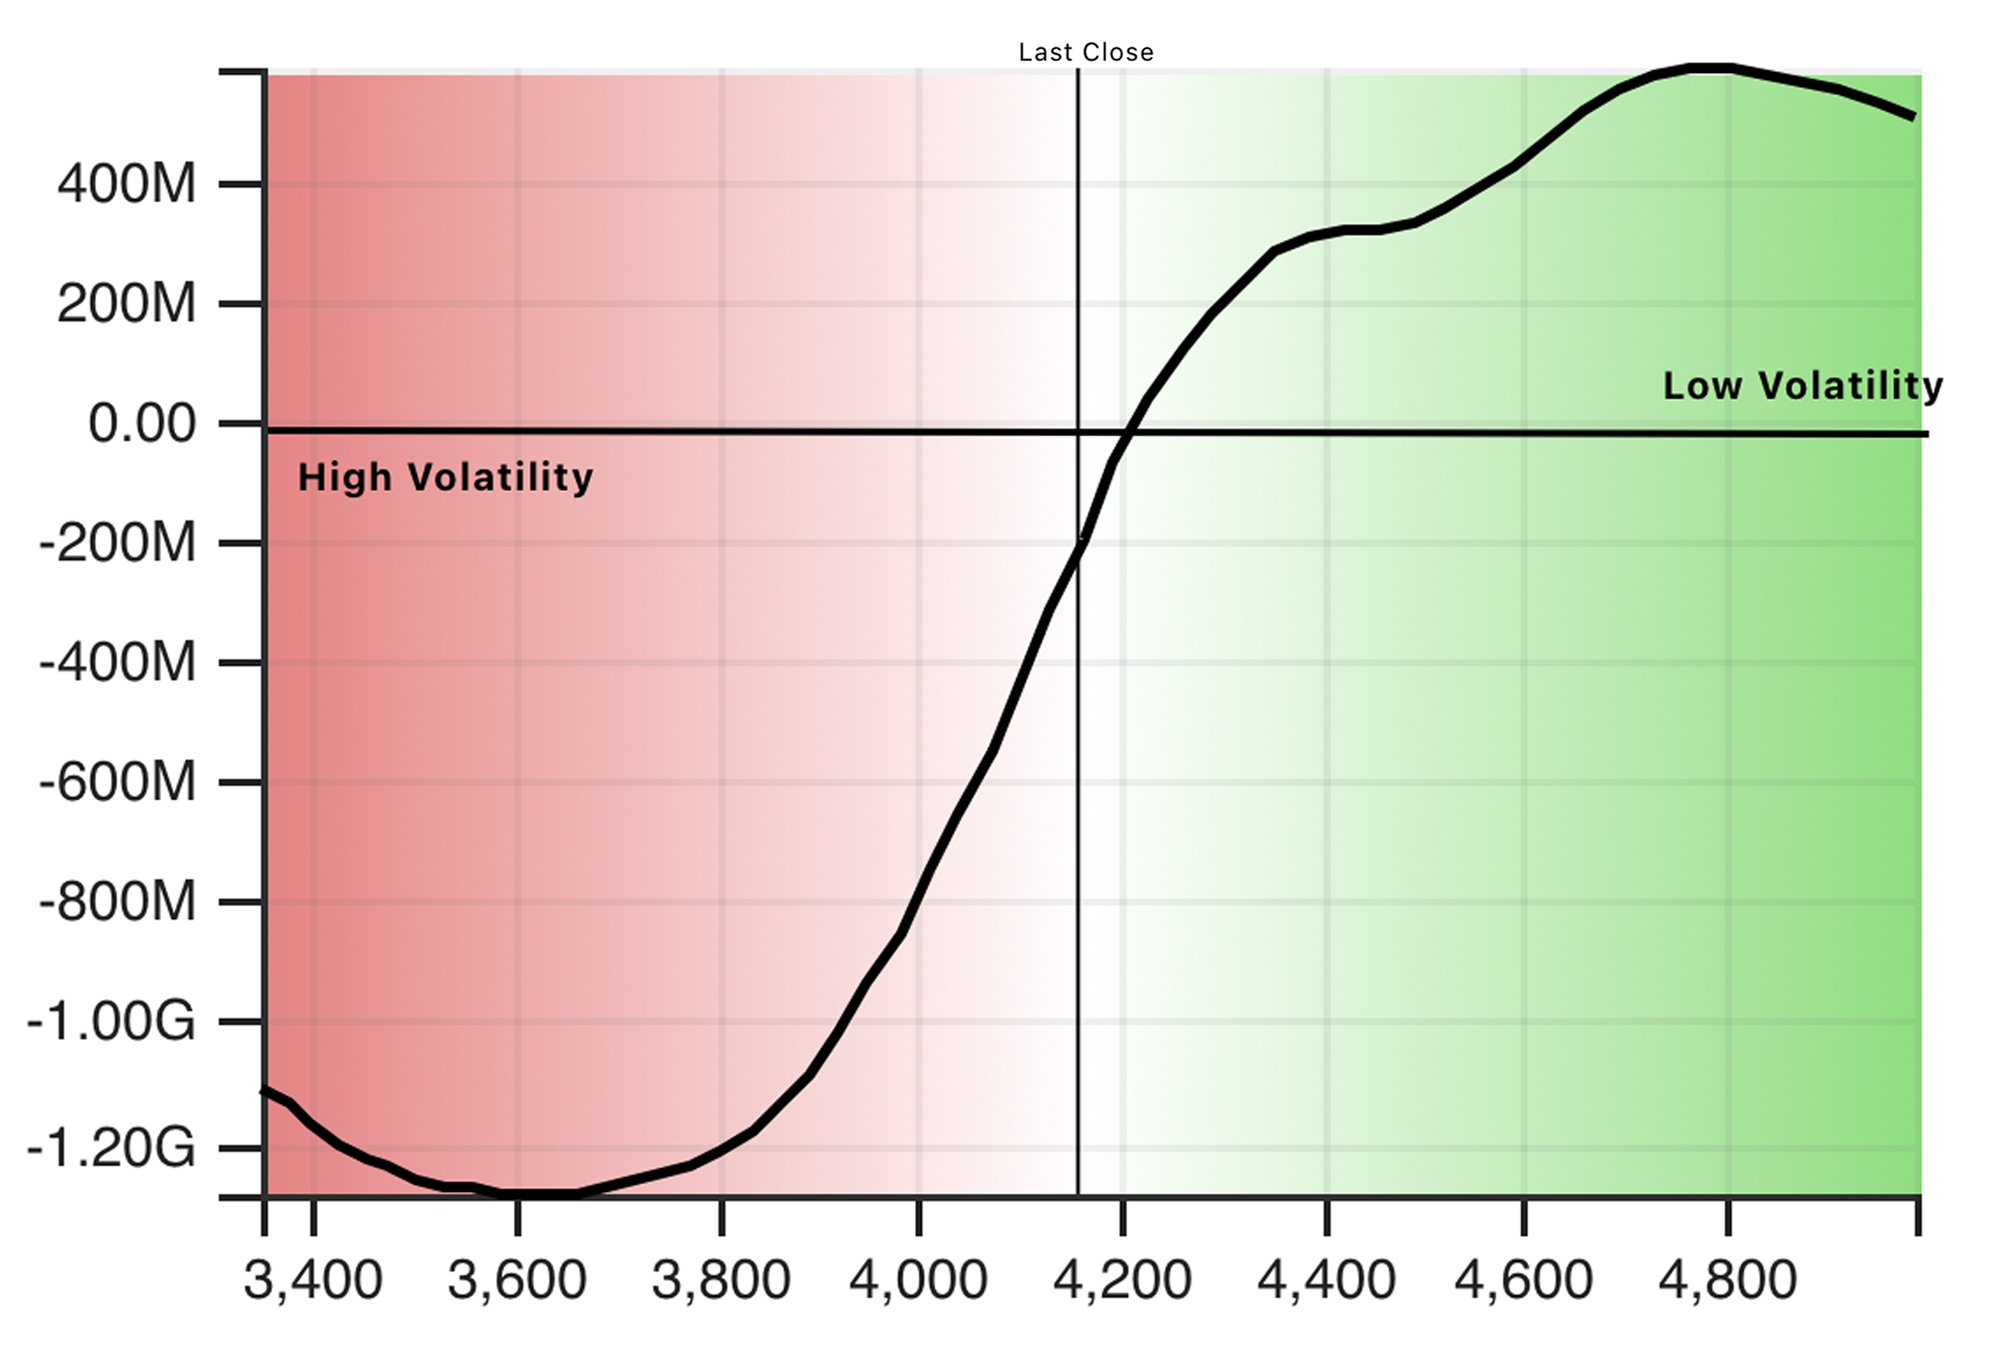
NET GAMMA CURVE
Gamma Exposure Chart
For a snapshot of market volatility, see our SPX standard net gamma curve.

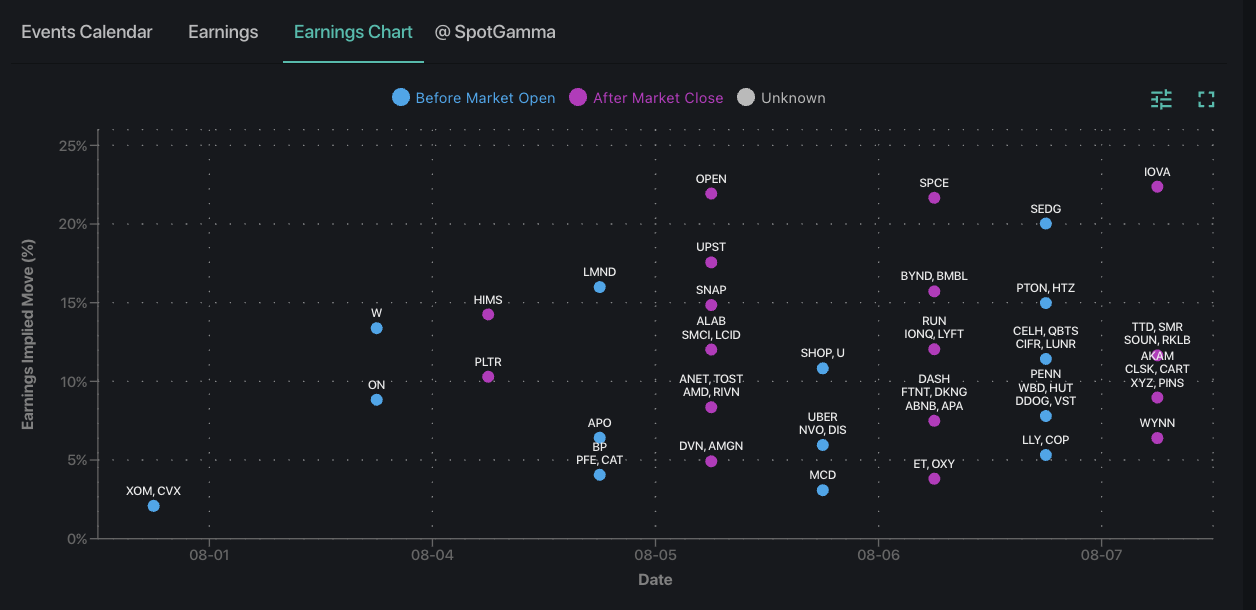
Earnings Season price moves
Implied Earnings Moves Chart
See estimated price movement chart for upcoming earnings releases.
Get ONE WEEK FREE of our daily FlowPatrol™ report
Uncover the Flows Moving the Market — Before They Move Prices
By subscribing, you agree with our Privacy Policy and provide consent to receive updates from our company.

