Overall price stability in the S&P 500 is masking one of the most unusual equity environments in recent years. While SPX has been roughly flat over the past month, the average constituent has moved 10.8% — a 99th percentile dispersion reading, as we discussed in our Thursday AM Founder’s Note. All signs point to increasing fragmentation beneath the market’s surface.
Last week, hidden stress once agan bled into the broader indices. SPX broke below its Volatility Trigger and Risk Pivot of 6,900, closing Friday at 6,836 with VIX spiking above 20. The Volatility Trigger marks the level where dealer positioning shifts from dampening downside moves to reinforcing them, which tends to define the broader regime. When price trades below the Vol Trigger, the market enters a more fragile state.
The SPX Volatility Skew chart below reflects the underlying market sentiment. Put skew has risen to 90-day highs above the 90th percentile, showing increasing demand for downside protection. However, IV Rank sits near 20%, indicating implied volatility remains relatively low compared to the prior year range.
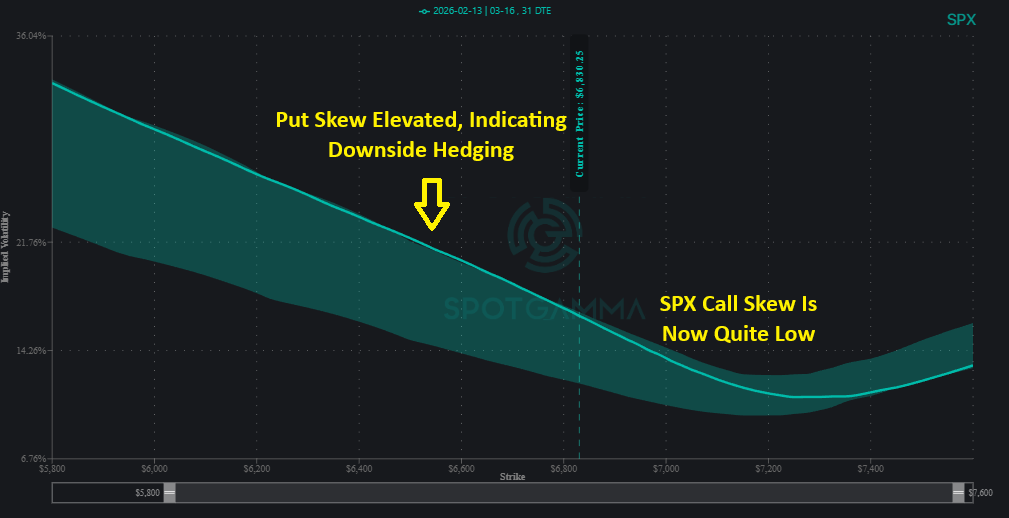
A low IV Rank means at-the-money options are still relatively inexpensive compared to recent historical values. When put demand rises while implied volatility remains compressed, it creates tension in the system. If price continues lower, volatility can expand quickly as downside hedging accelerates.
Our concern is that a sustained break below 6,800 would likely intensify the negative gamma-volatility feedback loop, opening a move toward the 6,600s. A reclaim of 6,900 would stabilize conditions, but until that level is recovered, rallies should be viewed cautiously given the fragmented market conditions.
How Long Could “Crypto Winter” Last?
The crypto winter is real, as Bitcoin has declined over 40% from ~120k in October 2025 to ~68k currently. Crypto-related ETFs and equities have also been hit hard, with the options market showing elevated put skew in these names.
However, Bitcoin delivered a noteworthy divergence amidst Friday’s equity weakness, rising roughly 4% on the day. IBIT gained ~5% and Coinbase (COIN) surged 16% post-earnings, suggesting traders may be positioning for asymmetric setups in beaten-down crypto names.
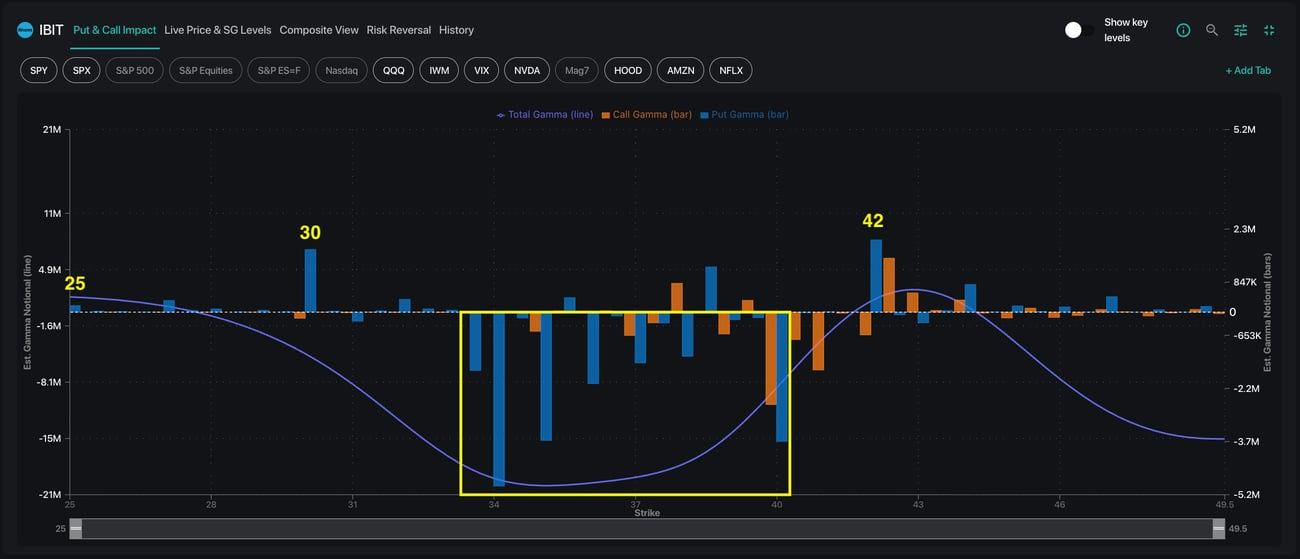
The IBIT gamma profile below shows the 33–40 strike range dominated by negative gamma, suggesting potential for volatility in either direction. Much of the positioning reflects customer put buying, indicating heavy downside hedging. Around the 30 strike level there appears to be a pocket of positive gamma, which may provide temporary support. Below the 25 strike, gamma exposure thins considerably, implying less structural hedging pressure if prices break lower.
Volatility metrics add further nuance to the crypto narrative. IBIT skew is currently at the 99th percentile, while IV Rank is much lower near 50%. One-month implied volatility sits at 56% compared to realized volatility at 73%, meaning implied volatility actually trades at a discount compared to recent realized moves. If realized volatility remains elevated, options markets may need to reprice higher.
FlowPatrol Highlights: NVDA and IVG Bounce Meaningfully
Even in unstable market regimes, opportunity often shifts rather than disappears. Our FlowPatrol system flagged significant institutional call spread activity in NVDA and IGV ahead of sharp rebounds.
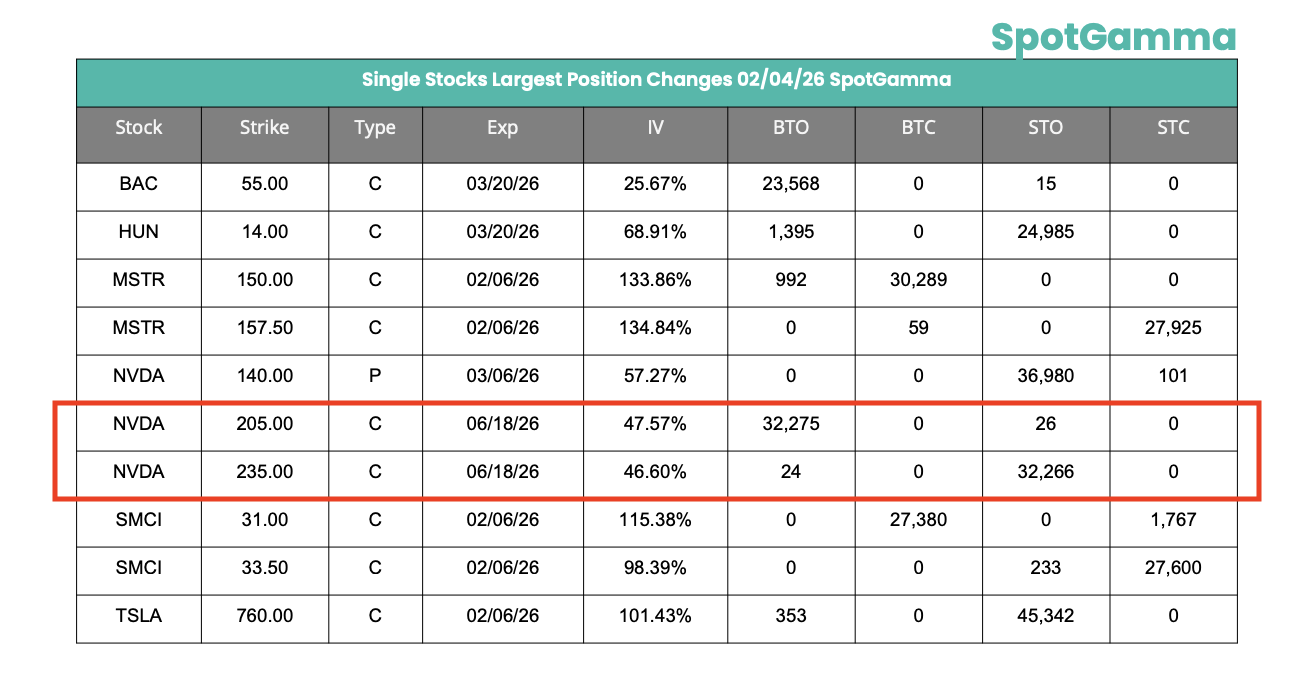
NVDA June 205/235 call spreads were opened in size on 2/4. The stock subsequently rallied 11% over two sessions.
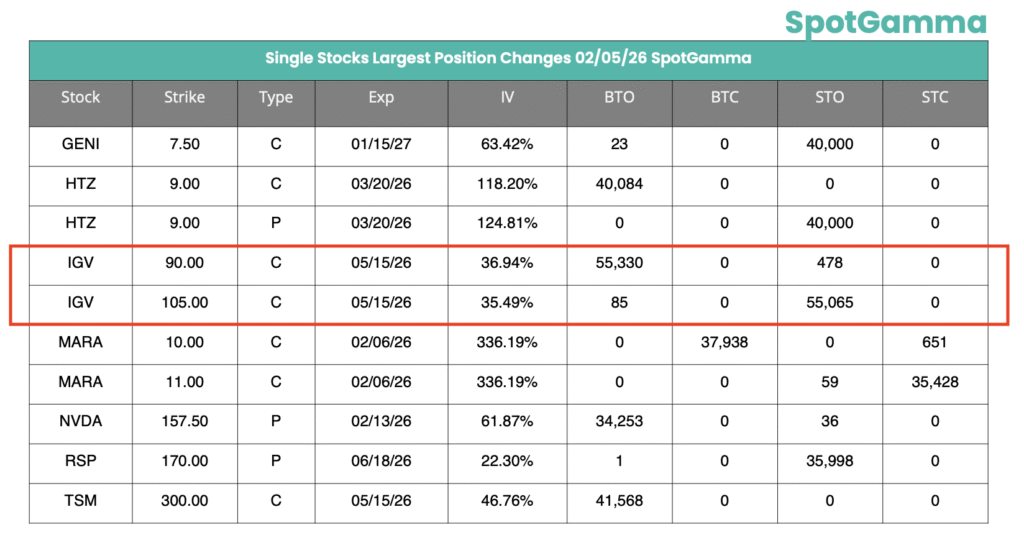
On February 5, a large IGV May 90/105 call spread was bought, followed by a three-session rebound. The positioning table below highlights concentrated activity at those specific strikes.
These trades underscore the significance of recent market dispersion. While index structure weakens, select names continue to attract upside positioning.
The (Short) Trading Week Ahead: VIX Expiration and OPEX
Markets reopen Tuesday into a compressed week: VIX expiration falls on Wednesday and OPEX on Friday, alongside Fed Minutes and PCE. These events can force re-positioning and increase volatility as dealer hedging adjusts, particularly if SPX gamma remains negative.
Key events to watch this week:
- Mon (2/16): US Holiday – Markets Closed
- Tue (2/17): PANW Earnings
- Wed 2/18: VIX Expiration, Fed Minutes
- Thu (2/19): Jobless Claims
- Fri (2/20): OPEX, PCE
The structural level to watch remains SPX 6,800. A sustained break likely accelerates downside toward 6,600. A reclaim of the 6,900 level would ease immediate pressure. Until then, the market remains vulnerable to volatility expansion beneath a deceptively flat index.