Market Fragility in the Face of All-Time Highs
As the S&P 500 pushes record highs, the options market continues to flash warning signals beneath the surface. Underlying risk from volatility discrepancies and index-equity correlation suggest an environment prone to vol spasms — similar to what we witnessed with Thursday’s (1/29) sharp selloff and reversal. These conditions point to a more fragile market structure than traders appear to be pricing in.
The dominance of 0DTE trading underscores the environment we see. On Wednesday, short-dated options sellers were positioned for record-low vol despite that day’s FOMC. We covered this in our pre-market Founder’s Note on Wednesday morning:
“Today we are shocked by the 0DTE straddle price: $31/44bps (ref 6,990) which is generally speaking very low – but head-scratchingly low on an FOMC day.”
The continued presence of 0DTE traders risks further compressing implied volatility, which would exacerbate any future vol spike. Equity call buyers did not demonstrate the same behavior, and they were instead increasingly long options: the gap in index-equity vol as measured by COR1M recently broke below 8. We see this as a significant risk-off metric, often preceding short-term market corrections.
Beyond FOMC, traders also had to navigate earnings results from four Mag7 names last week. Despite index vol reaching lows, relatively high single stock IV did not appear to be particularly imbalanced: TSLA and AAPL post-earnings moves remained within their implied range, while MSFT and META exceeded theirs.
While SPX briefly touched 7,000 for the first time, markets experienced a significant volatility spasm on Thursday that reinforced our concern: when everyone is short near-term index vol and leaning into single stock calls, it only takes a small catalyst to create outsized moves. The week ended with SPX closing below our 6,950 Risk Pivot, confirming a cautious stance heading into February.
An Extreme Reset For Gold & Silver
The precious metals complex delivered what has been some of the most dramatic moves of the year so far. Gold pushed to all-time highs above $5,400 mid-week before reversing sharply, falling nearly 9% on Friday to close below $5,000. The silver squeeze from early last week led to an even more eye-popping reversal as SLV fell 27% in a single session.
While news about the next Fed chair and strengthening dollar appeared to be the catalyst, the magnitude of the move was not a complete shock. Both SLV and GLD entered the week with IV Rank near 100%, and one-month implied volatility trading at a significant premium to realized volatility.
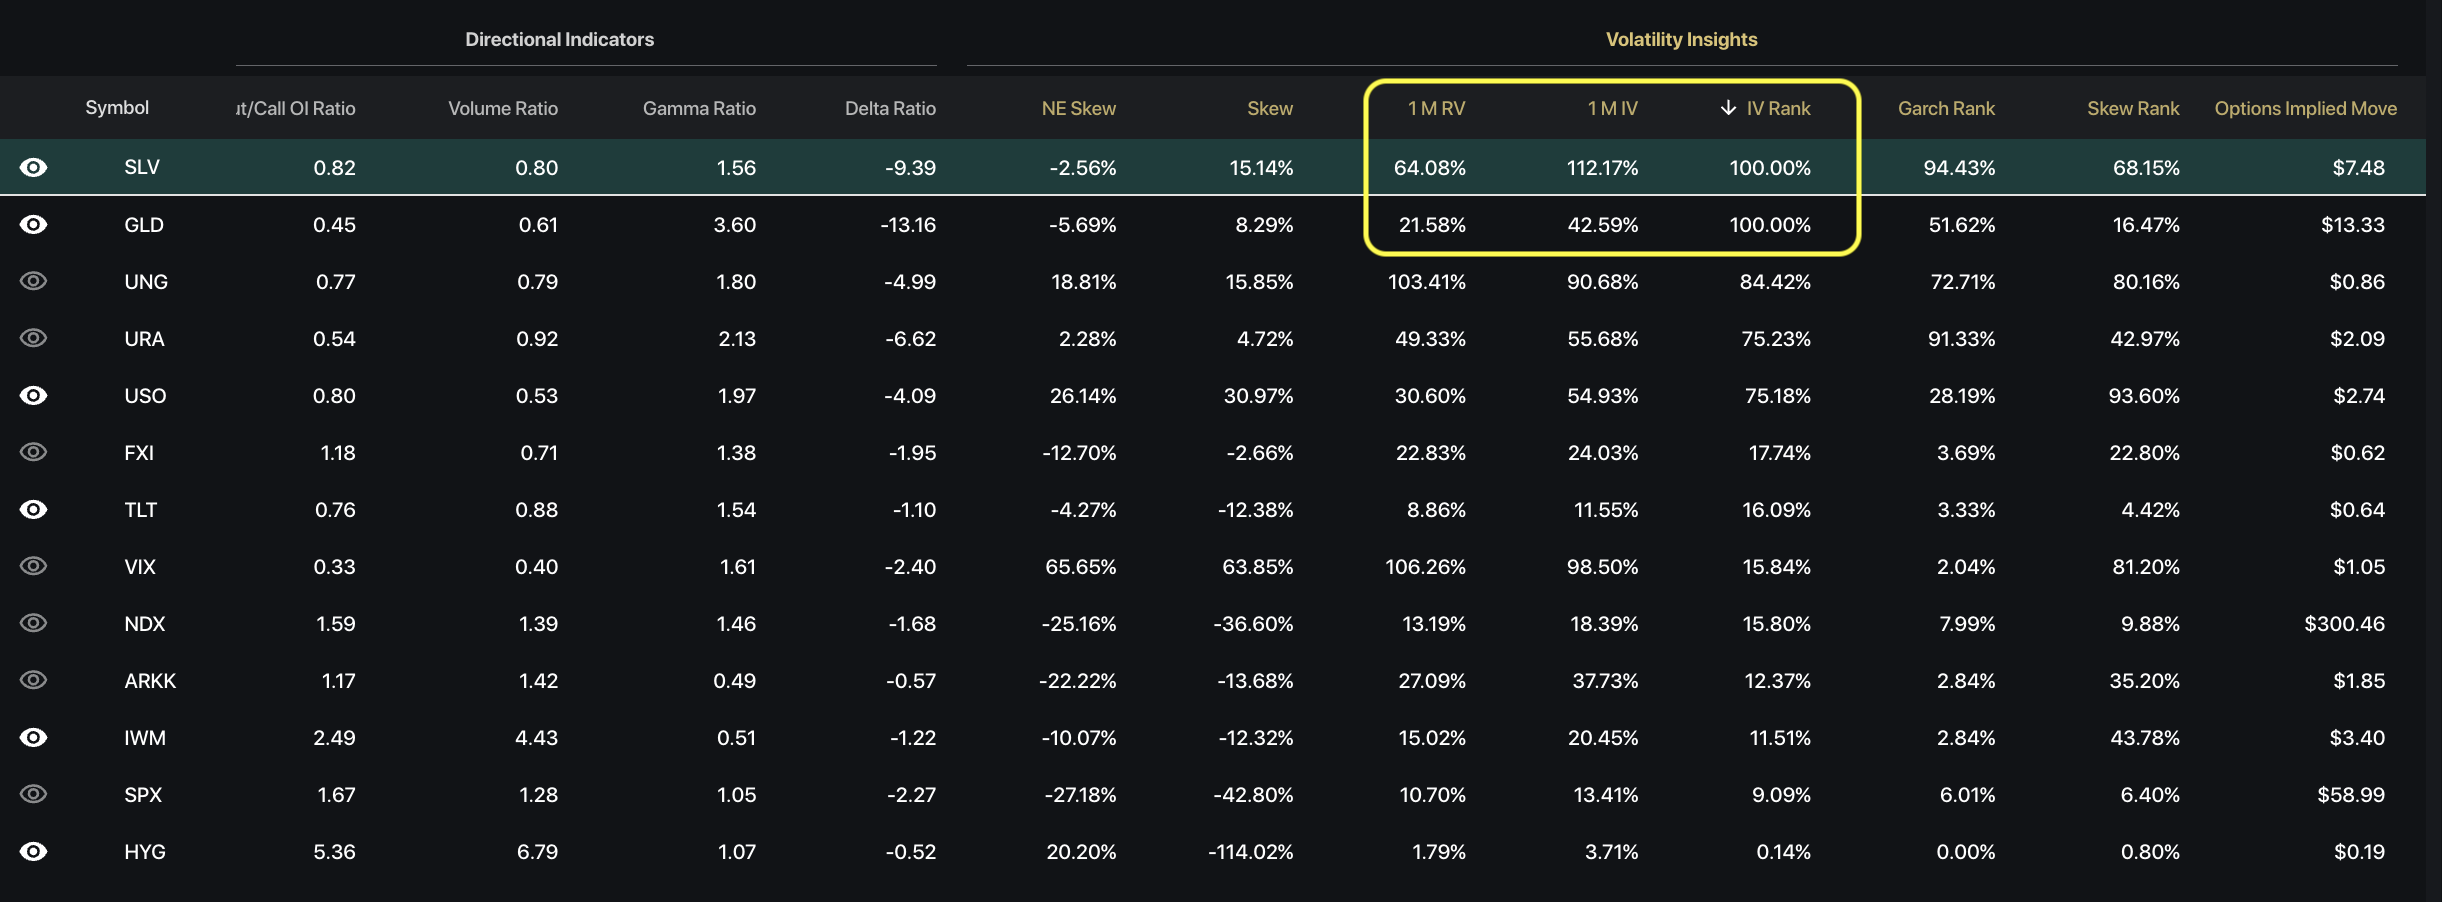
Notably, both GLD and SLV have had negative dealer gamma across virtually all strikes. Elevated historical volatility, combined with persistent negative gamma, can create conditions for extreme, two-sided price action.
Earnings & Macro Data: What Will Next Week Bring?
We see a packed week ahead for markets as earnings coincide with FOMC and major data prints on the With SPX now below the 6,950 Risk Pivot, we remain defensive heading into a data-heavy week led by NFP and major tech earnings.
Monday (2/2)
- Macro: ISM Manufacturing
- Earnings: DIS, PLTR
Tuesday (2/3)
- Macro: JOLTS
- Earnings: ER: AMD, AMGN, MRK, PFE, PYPL, SMCI
Wednesday (2/4)
- Macro: ADP, ISM Services
- Earnings: GOOGL, LLY, QCOM, UBER, ABBV, CME
Thursday (2/5)
- Macro: Jobless Claims
- Earnings: AMZN, BMY, COP, MSTR, RDDT, EL, KKR, MOH
Friday (2/6)
- Macro: NFP, Unemployment Rate, U Mich Sentiment
- Earnings: CBOE, PM, KVUE
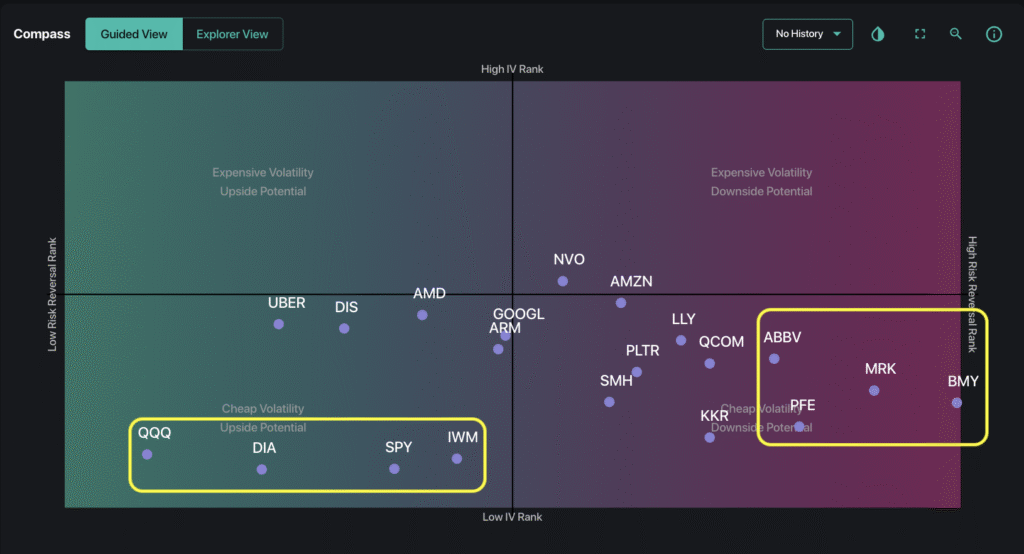
Recently, names such as GOOGL, AMZN, and PLTR have seen their skew reset in the wake of selloffs. These names are now sitting in the middle of our Compass tool as their Risk Reversal Rank shows call and put skew relatively balanced. In contrast, several healthcare stocks with earnings ahead (ABBV, PFE, MRK, BMY) remain skewed towards calls, reflecting more bullish positioning.
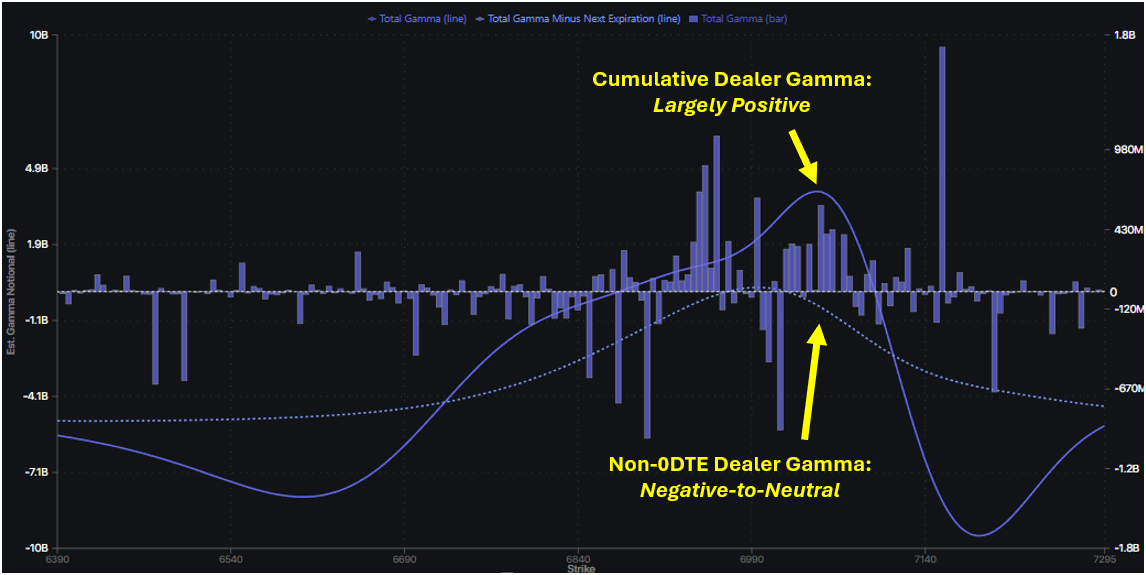
The dynamics that fueled last week’s volatility spasms have not improved — and in some respects, conditions have deteriorated. Dealer exposure has also grown increasingly negative below SPX 6,900, suggesting the potential for faster downside acceleration as dealers hedge with price action in the event of a selloff.
In this environment, the next volatility event may not experience the same degree of mean reversion that we saw last week. We will be paying close attention to the dealer gamma regime, and whether the market dips below our risk pivot level.