Friday’s massive selloff was a stark reminder of how markets can switch from calm to chaos at the drop of a hat. As volatility hit, the S&P 500 fell more than 1% in just a few minutes on October 10, closing the day down 2.7% in one of the sharpest single-day declines of the quarter.
Within the options market, headlines spooked traders and fear took over. In just a few hours. the at-the-money implied volatility (IV) for short-dated SPX options more than doubled from 11% to over 23% — the largest spike in months.
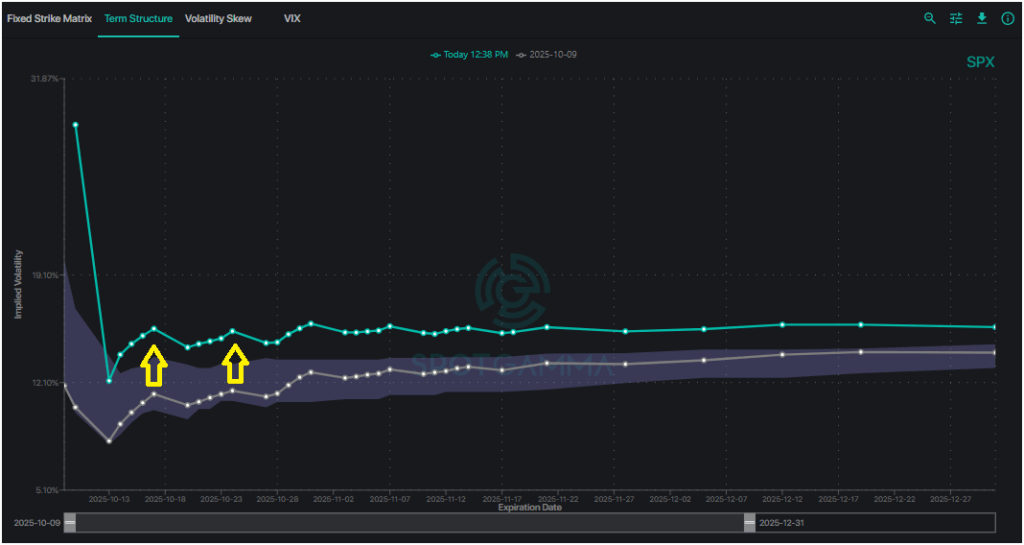
With the government shutdown preventing any new data releases, headlines around tariffs and trade risks filled the void, driving traders to reprice amidst heightened uncertainty. The bottom line: This was chaos.
There’s another event coming up, but unlike Friday’s calamity we have this one marked on our calendars: October Options Expiration (OPEX).
Check out our live stream and analysis of October’s OPEX here.
The OPEX Volatility Reset: Why Expiration Week Often Marks a Turning Point
OPEX occurs on the third Friday of every month, when monthly options contracts expire for both major indices, ETFs, and single stocks. This expiration date acts as a “reset date” for markets — often causing volatility to spike, or to collapse.
The impact of OPEX extends to both single stocks and indices, and when trading volatile markets, you need to translate what is happening in the broader market to your individual positions.
Whether volatility is spiking, crashing, or stagnant, your trading success ultimately depends on how these dynamics influence underlying prices.
The Hidden Force Behind Options Pricing
If you’re trading options, then you’re trading volatility. Volatility sits at the core of options pricing. Implied volatility reflects the market’s expectation of future price movement, directly influencing the premium traders pay for options.
When IV rises, all else equal, option prices increase. When IV falls, prices drop. That relationship makes volatility a powerful driver of profitability for any options trade. The challenge for traders is recognizing how fast IV can change, and how those shifts can affect your position.
From IV to PnL: Turning Volatility into Trading Insight
Implied volatility changes based on trader sentiment, and the prevalence of options buyers vs. options sellers for any given strike and expiration. More buyers of options translates to higher IV, and more sellers means lower IV.
Those shifts don’t happen evenly. IV for longer-dated options can move very differently than for short-dated options, and IV can behave in different ways for upside vs. downside different strikes.
SpotGamma’s new Options Calculator, launching this month, is built to help you visualize how changes to implied volatility affect your trades.
Implied Volatility in Action: How Market Shifts Move Your PnL
The selloff last Friday, October 10, gave traders a clear look at how fast implied volatility can move — and how those swings dramatically reshape options prices. Moves like that raise important questions for any options trader:
- What happens to your PnL if implied volatility spikes again?
- How are my positions affected if volatility collapses?
- What if IV shifts unevenly across strikes?
Volatility Dynamics: Understanding the Impact on Your PnL
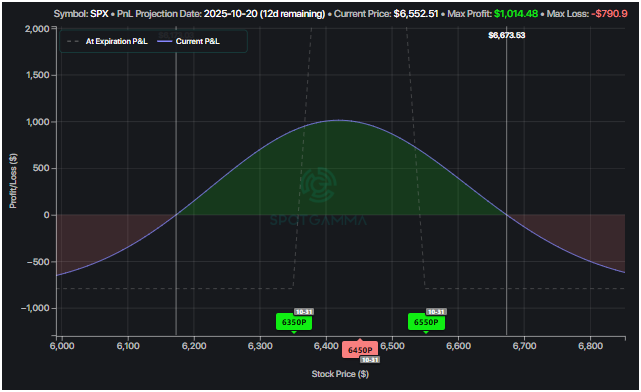
Let’s break down a real setup using a bearish SPX put fly to see how those volatility shifts play out in your PnL.
- Objective: Capture neutral price action to medium downside volatility while maintaining defined risk for a profitable range from 6,180 to 6,600
- Strikes: bought SPX $6,550 put, sold 2x $6,450 puts, bought $6,350 put
- Expiration: October 31 (post-OPEX)
- Range of profitability (measured for October 20): $6,172 to $6,674
- Max potential profit: $1,014 if SPX settles near the center $6,450 strike at expiration.
With SPX trading at $6,650 at the present time, a put fly can capture downside volatility to $6,180 while offering capped risk in the event of a major correction.
Let’s take a look at what happens if volatility were to revert back to the median IV of the past 90 days by that same date, October 20:
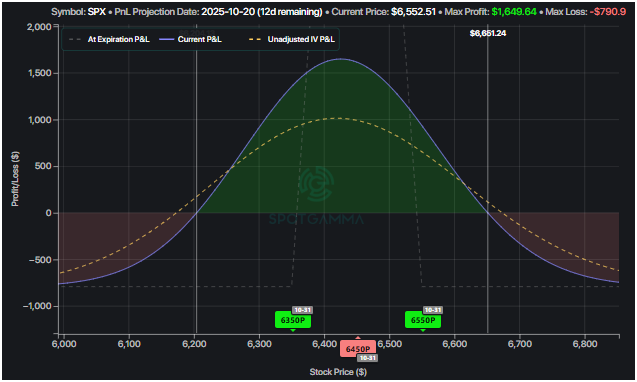
The yellow line in the image above represents the previous PnL, while the green and red section shows what the return profile looks like after adjusting IV.
In the case of volatility reverting back to its median level, the range of profitability shrinks just slightly to SPX $6,202 through $6,651. However, the maximum profit increases by 50% at the 6,450 strike — a clear sign of how subsiding volatility can increase the value of this trade.
Using the SpotGamma Options Calculator, you can see how setups like this put fly might appeal to traders betting that Friday’s panic fades and that volatility mean-reverts.
Shifting Skew: How Uneven Volatility Changes the Game
It’s important to remember that IV can expand or contract differently across strikes — meaning a shift up in volatility to the downside does not mean an equivalent shift to the upside.
During Friday’s decline of nearly 3%, traders bought downside protection in the form of puts en masse, causing IV below 6,700 to increase significantly.
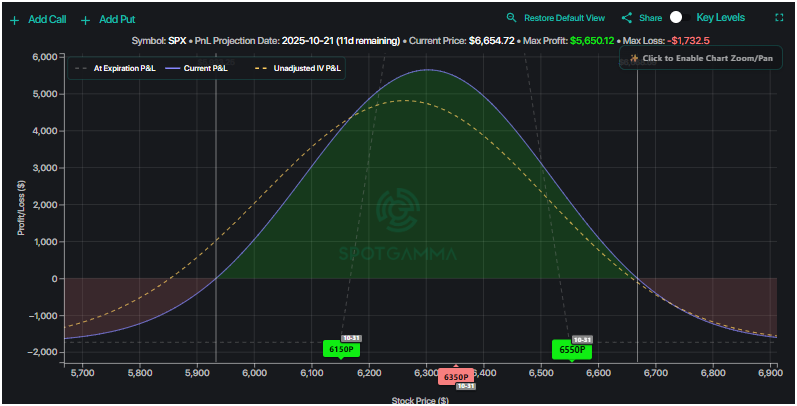
What would happen if implied volatility levels remained elevated, but just the downside skew receded back to what it looked like before Friday’s correction?
Using the same SPX put fly as the previous example, notice how this change in skew shifts the PnL unevenly.
The lower leg of the spread loses value faster than the upper legs, slightly narrowing the range of profitability compared to the original PnL (yellow dashed line).
Understanding how IV and skew directly influence your PnL is key to understanding a good trade — which applies to both the present situation, or any environment you may be trading.
The Takeaway: Hidden Forces Impact Every Trade
Last Friday’s move reminded every options trader of one truth: If you are trading options, you are trading volatility. OPEX establishes a date each month to watch, so you can capitalize on shifts in volatility as options contracts expire and positioning resets.
That’s exactly what we explored during our OPEX webinar on October 15 — a live session unveiling how you can use SpotGamma’s new options calculator to measure the impact of volatility on your trades. Sign up now and you’ll also get first access to five new SpotGamma tools built to help you discover the impact of the options market on your trades.