Walmart reports this week, with its options market pricing a roughly 6% move as investors assess consumer resilience, holiday spending and retail margins.
Walmart (WMT) headlines a busy week of retail earnings as it prepares to report quarterly results ahead of the critical holiday shopping season.
Walmart remains the sector’s defensive heavyweight, benefiting from grocery spending and digital growth.
For options traders, the key question isn’t simply whether earnings beat expectations. It’s whether the results justify the movement already priced into options—and whether dealer positioning amplifies or absorbs the reaction.
1. What Is the Options Market Pricing?
Walmart reports fiscal third-quarter results Thursday, November 19, before the opening bell.
Wall Street expects approximately $0.64 in adjusted EPS and $187 billion in revenue, with management previously guiding quarterly EPS to $0.62-$0.64.
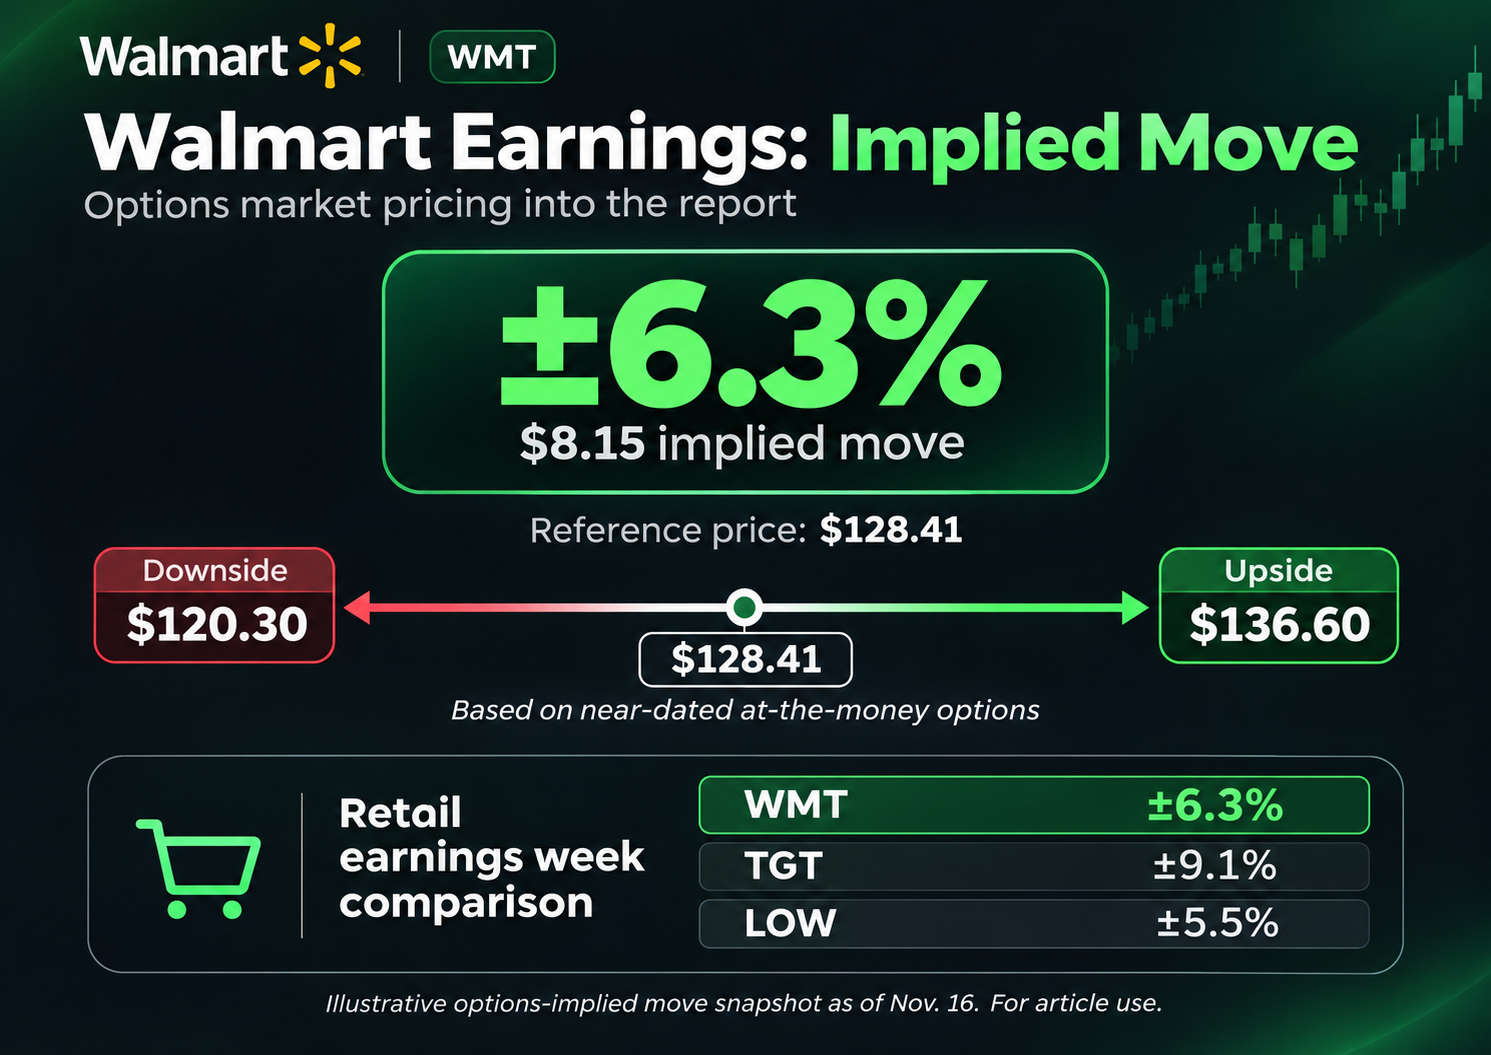
As of November 16, WMT traded near $128.41, with November 20 at-the-money options pricing approximately $8.15 of movement, or 6.3%.
That translates into an approximate earnings-week range of:
- Upside boundary: $136.60
- Downside boundary: $120.30
These are options-implied reference levels, not guaranteed support or resistance.
The takeaway: Walmart faces meaningful event risk despite its relatively defensive business model.
2. Walmart Volatility Skew: Is the Market Hedging Downside?
Walmart’s volatility structure offers clues about how investors are positioning ahead of Thursday’s report.
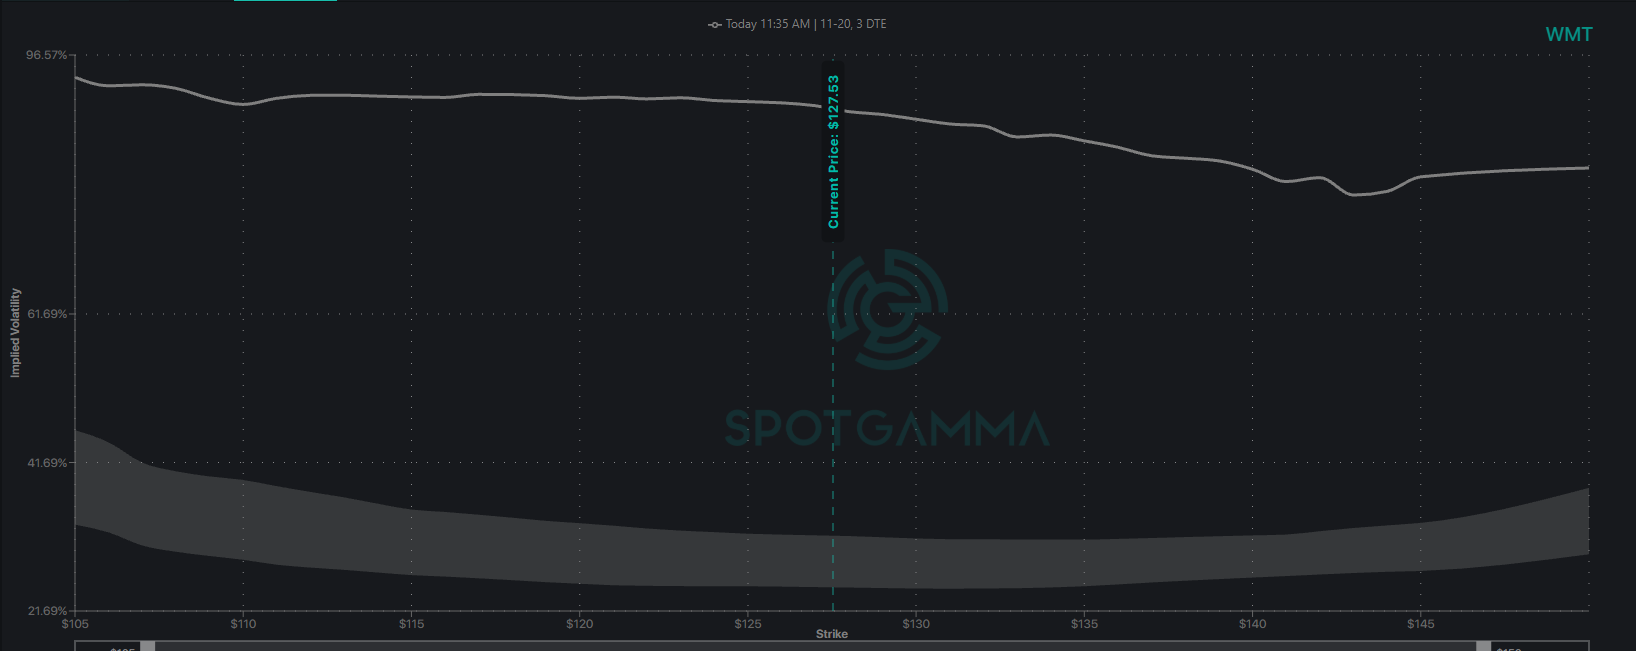
November 16 options data placed 30-day at-the-money implied volatility near 34%, compared with approximately 24% realized volatility over the preceding 30 trading sessions.
However, the downside skew remains relatively modest. A 25-delta comparison showed puts trading approximately 0.8 volatility points above comparable upside calls near the 30-day maturity.
This suggests investors are paying elevated premiums for earnings uncertainty without displaying overwhelmingly aggressive demand for downside protection.
Near-dated implied volatility is also substantially higher than longer-dated volatility, creating exposure to post-earnings volatility compression.
Trading implication: Buyers of outright calls or puts need a sufficiently large directional move to overcome both the premium paid and the expected decline in implied volatility.
3. Dealer Gamma: Important Levels Around Walmart
Dealer positioning could play an important role in determining whether Walmart’s earnings reaction develops into a sustained trend.
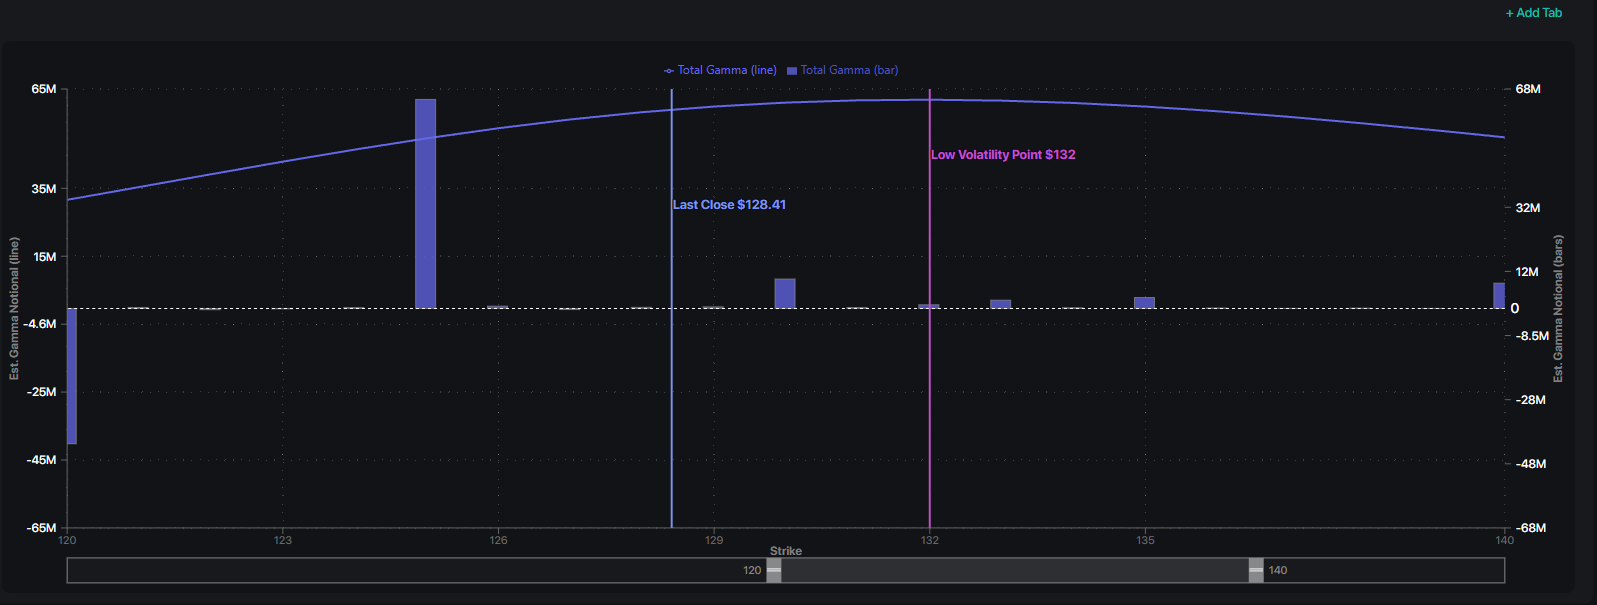
Spotgamma’s Synthetic OI gamma model as of November 16 identify notable concentrations around $125 and $130, with a modeled gamma transition near $123.
At approximately $128, Walmart sits between two important options concentrations.
The $130 area represents the first potential upside inflection point. A sustained breakout could put the upper implied-move boundary near $136 in focus.
Conversely, a break below $125 would shift attention toward the estimated gamma transition around $123.
Under a positive-gamma environment, dealer hedging can dampen price movements as liquidity providers sell strength and buy weakness. In negative gamma, hedging can become more procyclical, potentially amplifying directional moves.
These relationships are conditional, and positioning can change materially following earnings.
The key question: Will Walmart remain contained within nearby options concentrations, or will earnings trigger a more directional hedging environment?
4. Fundamental Catalysts: Can Strong Execution Continue?
Walmart enters earnings following another quarter of impressive digital growth, although its previous 2.6% U.S. comparable-sales increase fell short of Wall Street expectations.
Global eCommerce sales increased 23%, while Walmart’s global advertising business grew 38%, highlighting continued momentum in higher-margin digital operations.
Management also raised its fiscal 2027 outlook, forecasting net sales growth of 4%–5% and adjusted operating income growth of 7%–8.5%, both in constant currency.
Investors will focus on four developments:
- Holiday demand: Whether value-conscious consumers continue shifting spending toward Walmart.
- Merchandise trends: Grocery resilience versus discretionary-category performance.
- Digital profitability: Contributions from eCommerce, advertising and memberships.
- Forward guidance: Margin sustainability, tariff-refund effects and operating costs.
Given Walmart’s premium valuation, another earnings beat may not be sufficient without encouraging forward guidance.
5. Three Walmart Post-Earnings Scenarios
Using the November 16 reference price and options-implied range, the following scenarios establish a framework for interpreting Thursday’s reaction.
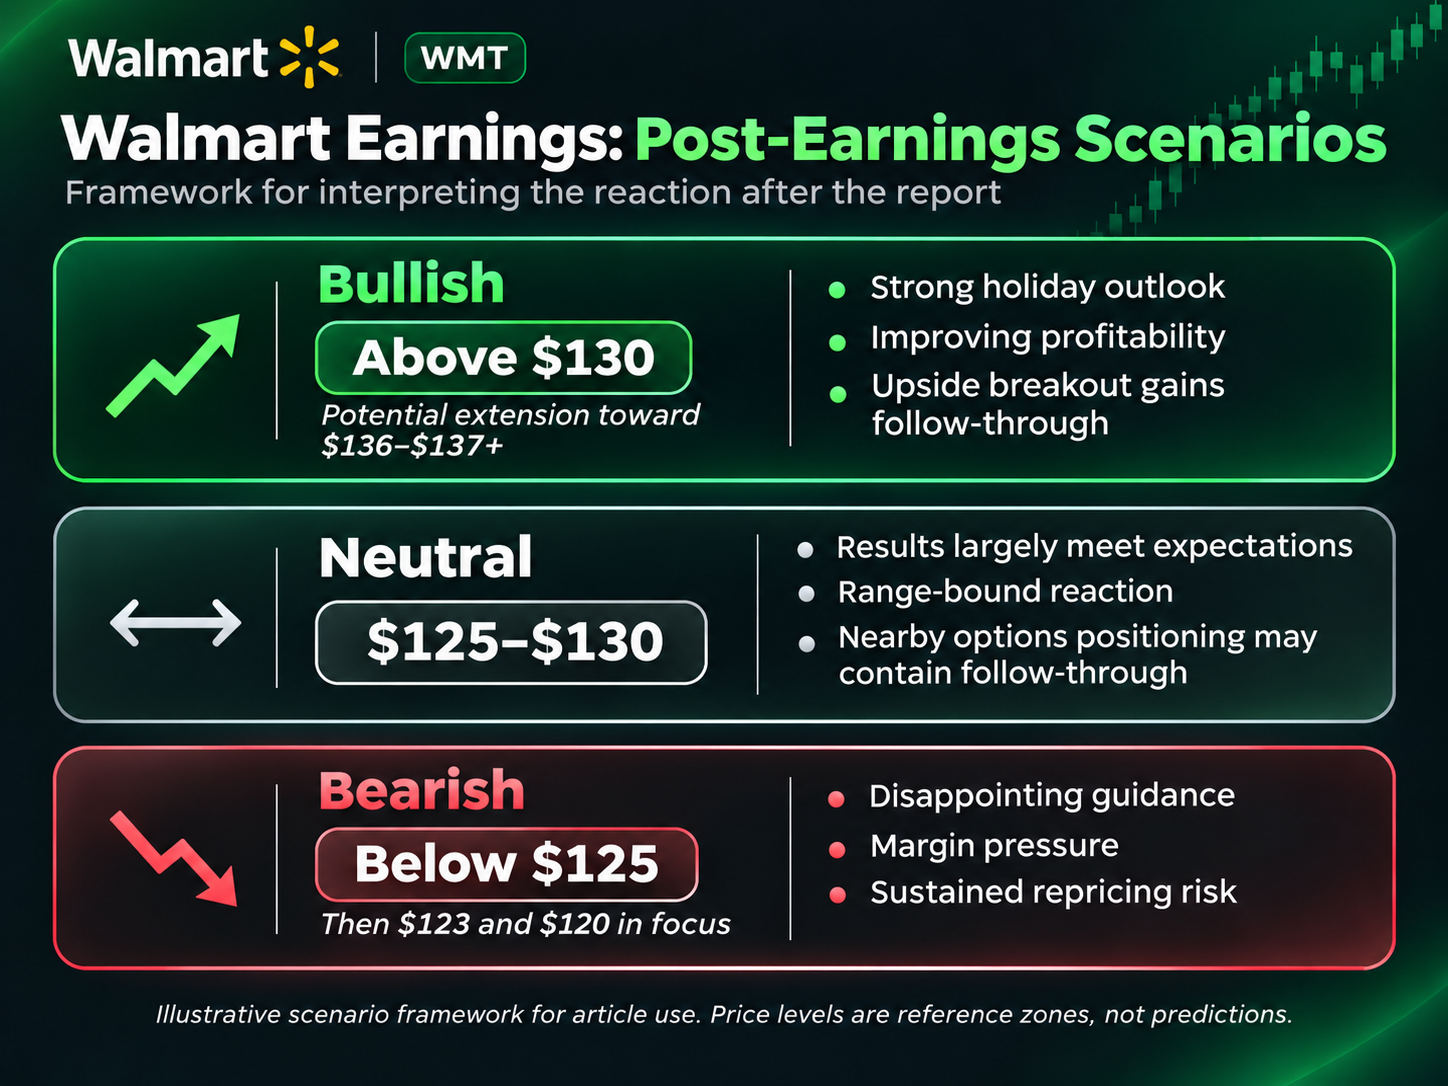
Bullish — Above $130, targeting $136-$137+
Strong comparable sales, resilient margins and encouraging holiday guidance support a breakout through $130 toward the upper implied-move boundary.
Neutral — $125-$130
Results largely meet expectations without materially improving the outlook. Shares remain range-bound as event volatility collapses.
Bearish — Below $125, then $123 and $120
Disappointing guidance or margin pressure triggers selling. A sustained break below $125 shifts attention toward the estimated gamma transition and lower implied-move boundary.
The direction and persistence of the reaction matter more than the initial opening gap.
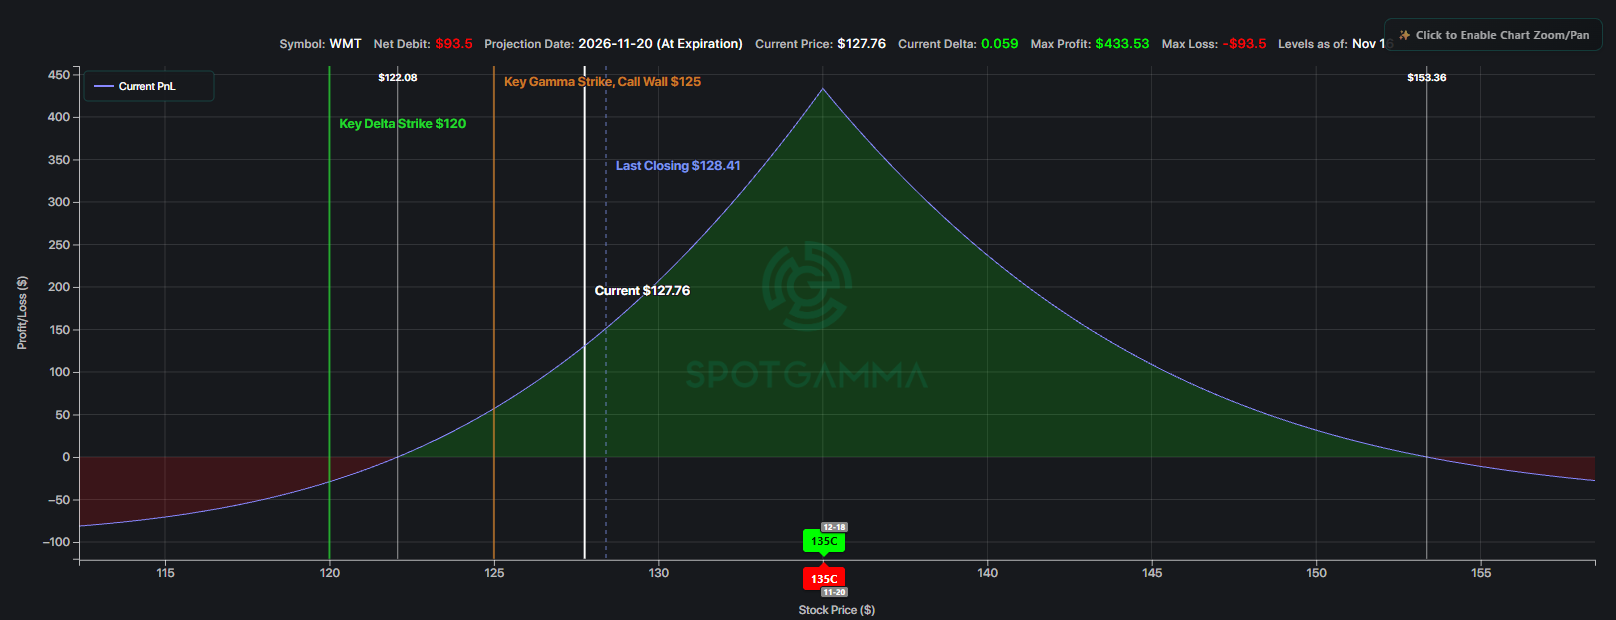
6. Options Trade Idea: Walmart $135 Call Calendar Spread
With Walmart’s near-term implied volatility elevated ahead of earnings, a bullish call calendar spread offers an opportunity to capitalize on expensive short-dated options premiums while maintaining upside exposure.
Illustrative Trade Structure:
- Buy: WMT December 18 $135 call
- Sell: WMT November 20 $135 call
- Estimated net debit: $1.00
- Ideal target: WMT near $135 following earnings
The $135 strike sits near the upper end of Walmart’s approximately 6.3% earnings-implied move.
This structure benefits most from a controlled bullish reaction toward $135, allowing the November call to lose event premium while the December call retains time value.
Key Risks: A sharp move above or below $135 could reduce profitability, while declining December implied volatility may offset the benefit of short-call premium compression.
Traders should consider closing the position following a favorable reaction and manage the November short call before expiration to avoid assignment exposure.
Final Thoughts
This week’s retail reports offer an important test of consumer spending heading into the holidays.
Walmart will test whether value-focused retail and digital growth justify premium expectations.
For Walmart, $130 is the initial upside trigger, while a break below $125 raises the risk of further downside.
Ultimately, the most important signal may come not from whether Walmart beats earnings expectations, but from how the stock reacts relative to the move options have already priced in.