GME Gamma Squeeze – What Happened?
Yesterday GME saw another massive price move with the stock ripping over 100% from $45 up over $160 in after hours trading. This move was likely fueled by an options gamma squeeze as we’ll explain here.
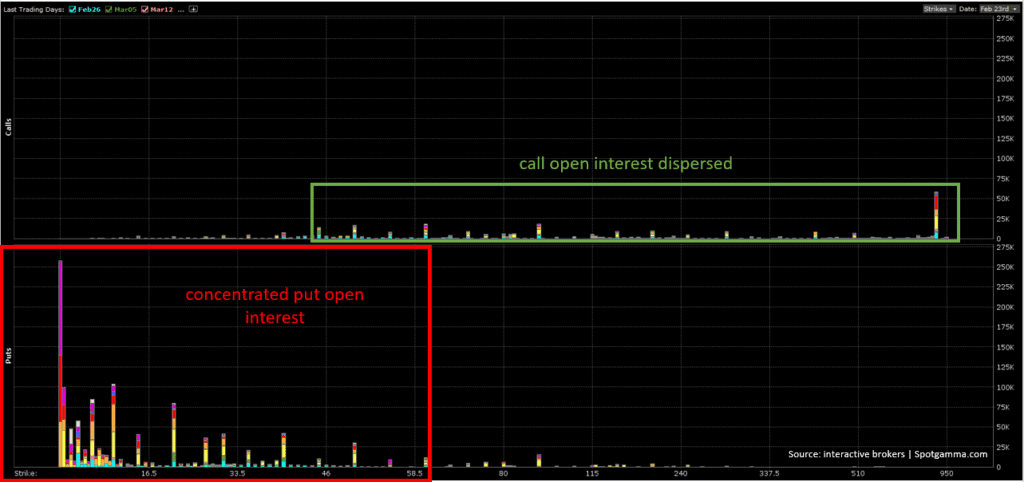
First, note the existing options positions in GME, from the day prior to yesterdays squeeze (Tuesday, 2/23). There was a large concentrated put position as highlighted in red box below. Call options in decent size were also spread from 40 up all the way into the 500 strikes (green box). This infers that as the stock started to lift off, all of those put positions started to bleed in value, which may have allowed market makers to reduce their short stock position. As the stock lifted higher all of those preexisting call positions start to pick up in value, requiring additional long stock hedges. In other words the “pump was primed” for a gamma squeeze.
From the days start there was fairly strong “bullish” options flow which picked up in spades after 1pm. This chart portrays the initial hedging requirement due to new options trades (delta hedge). Recall that as the stock moves higher, more stock must be purchased to re-hedge (gamma hedge).
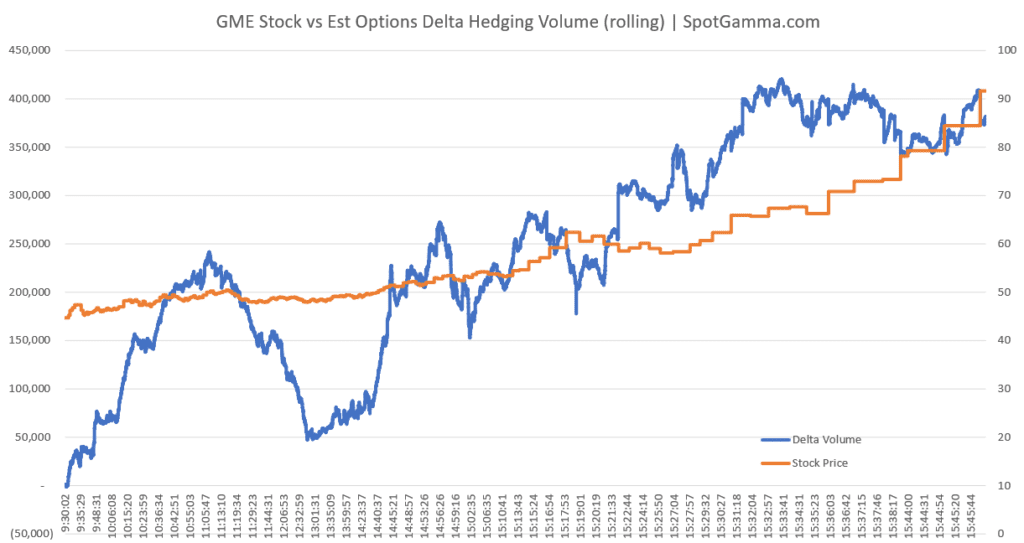
We’ve indicated where the bulk of these options flows picked up in the GME price chart below.
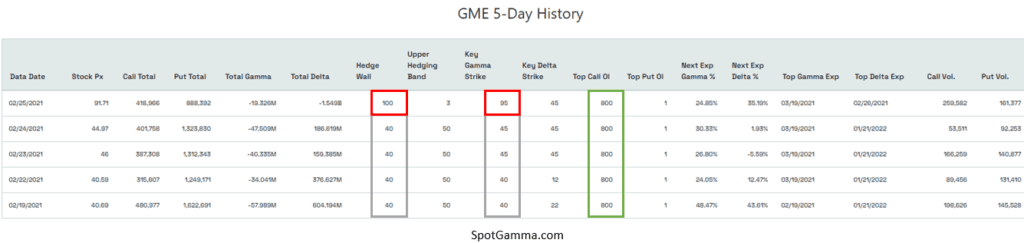
The net result of the new options positions from Wednesday, and GME stock price jump is that the center of options hedging activity (ie large gamma strike) has shifted from 45 to 95. This indicates that major hedging flows will now be tied to that level, which could set up as support. Its important to note that these options price levels shift daily.
GME Prices: Looking Ahead
It is likely to be a challenge for GME to reach & sustain similar price heights as before (>$200). The main reason for this is that we think options market makers are going to be much faster to raise the price of options. The primary method options market makers have of deterring option buyers is to raise the costs of options, which should start to limit demand. This in turn may mean that marker makers risk and hedging requirements declines.
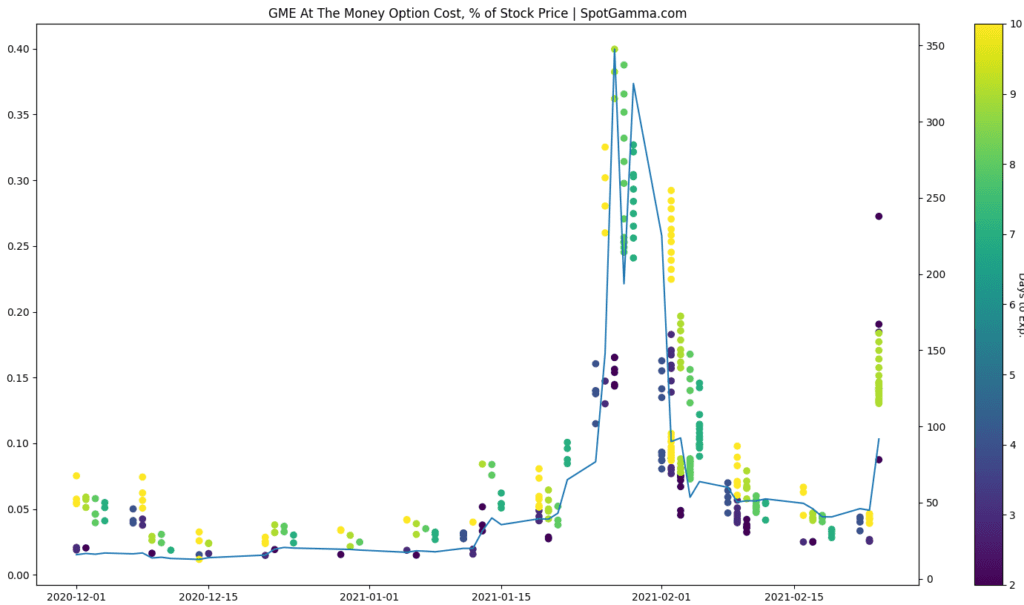
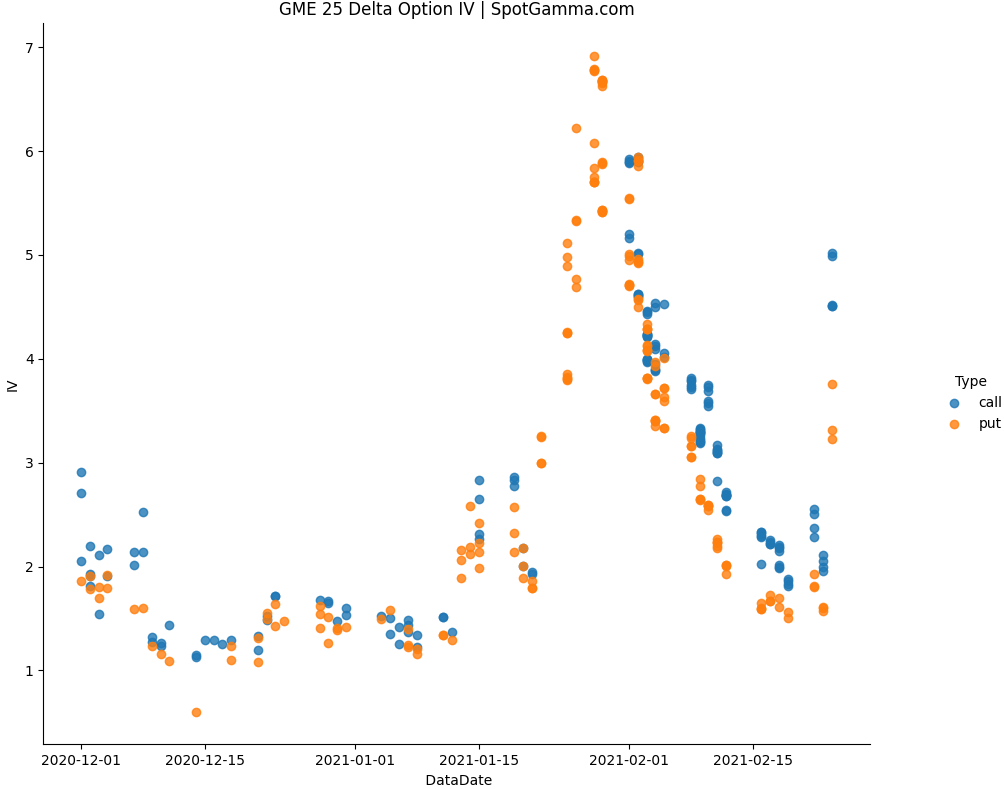
During the last price jump the cost of options (i.e. implied volatility) rose to very high rates, but it did not seem to deter call buying. This demand was primary to the initial options gamma squeeze, as we detailed in our previous analysis. Yesterday though options prices rose dramatically, surging past relative levels from similar GME price jumps.
You can see this below, where we show the cost of at the money option (left axis). Each dot represents a different expiration date, with an option strike equal to where the stock last traded. The thin blue line shows the price of GME stock (right axis). Last night with GME stock closing near $100, the cost of an option was nearly 3x that of the last time GME was near $100.
This similar chart below shows the options in implied volatility terms, and you can see that the cost of call options (blue dots) rose well past that of put options (orange dots).
If call sellers begin to show up in earnest, that can allow the market makers to sell long stock hedges. We believe this was a strong reason as to why GME stock dropped from >$200 down to $60. The mechanics of this trade our outlined here: The GME Gamma Trap.