$GME vol has totally faded, just like the interest in @TheRoaringKitty twitter feed (sooo many video clips – that can’t be him posting).
Anyway, here we see the peak in 1-month IV at +340% on Tuesday (yellow) when the stock hit >$60. Stock up, vol up.
Now the IV’s (and GME’s stock price) have come full circle, as you see by today’s skew (teal) at last weeks skew level (gray). Stock down, vol down.
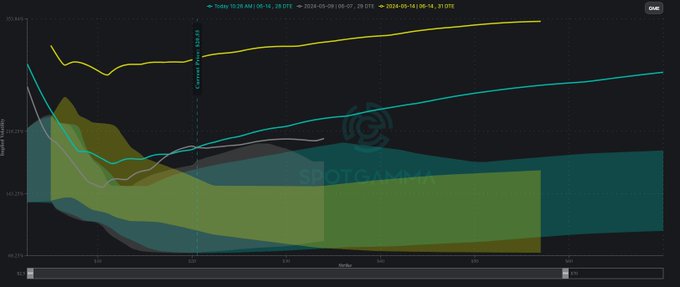
Statistical ranges for 1-month GME skew highlight how extremely elevated IV levels have now collapsed. From spotgamma.com
The shaded areas above are the statistical ranges for 1-month GME skew. As you can see, IV/skews were (and still are) well above average.
In situations like on Tuesday, when the stock & IV rips higher, you were really paying up to buy options – particularly upside strikes (calls). You get a feel for this by how Tuesday’s IV (yellow lines, above) were so far above the statistical range (yellow shaded area).
Consider if you bought the 1-month $60 calls on Tuesday AM (when the stock opened at $60), you paid $20. Those things are now worth ~$1. Buying those calls at IV of ~340% is looking for something like 21% daily moves in the stock.
While that type of move is possible for a day or so, its not likely sustainable. Sustainability is a problem because should the stock simply pause, that IV is going to come down, taxing your long call position.
Imagine instead, you wanted to fade the stock, so you bought the 1-month $20 put (where the stock was 1 week ago). You paid $2.5 for that option when the stock was ~$60, but IV was +300%.
With IV so high, that option was more of a “long vol” (i.e. vega) trade than a “short stock” (i.e.) delta trade. Being long vega is great if IV is going up, but may be a painful tax in situations like this, where IV goes dramatically lower as the stock drops.
Here you can see some sample greeks of this put, with the stock at $50 and IV at ~300%.

Sample greeks for the 1-month $20 put option, stock $50, IV 300%.
Compare that to the price & greeks of the same option & stock price, just with the IV at 150%:

Sample greeks for the 1-month $20 put option, stock $50, and IV 150%
Fast forward to now, with the stock down to $20, your 20 strike put is only just now worth $3.75, even though GME stock is -60% in 2 days.
As you can see here, this option price only jumped today as the stock moved to the strike of the aforementioned put ($20). The previous days the money made from the stock decline (i.e. delta) was being offset by the decline in IV (i.e. vega).

Despite GME’s sharp decline, the 20 strike put only gained value as the stock neared the strike price, demonstrating the offsetting impact of IV decline on option pricing.
Our point here was to illustrate the impact of declining IV’s after manias.
Obviously with options there are unlimited ways to craft different positions to confront changing dynamics. To offset the change in IV, you could enter into various types of spreads, and/or change strikes and tenor (expiration).
To help you navigate the volatility landscape in the future, give our Alpha subscription a shot: