This week delivered everything from mini-flash crashes to meme stock explosions, capped off with a July OPEX that reinforced our thesis about dangerously complacent volatility expectations.
Our key levels proved their worth again this week: resistance at 6,325 limited upside attempts, and support zones at 6,250 and 6,200 provided reliable bounce points. The 6,200 pivot level remains the critical line in the sand – bearish with higher volatility expectations below, and more bullish & stable conditions above.
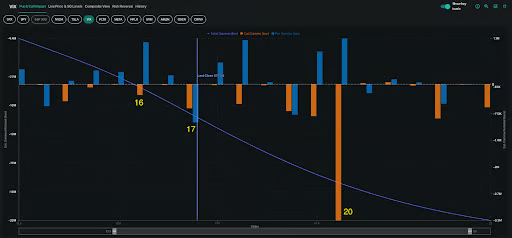
Following Wednesday morning’s VIX expiration, the index has found support near 16 despite continued equity strength pushing the overall market to new highs — a notable divergence.
Our synthetic OI model points to 16 as the key pivot level based on market maker positioning, with positive gamma providing solid support below. A further breakout above 17 opens the door for a squeeze to 20.
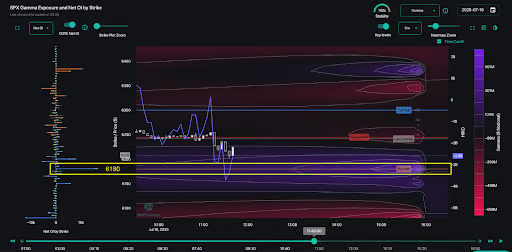
The week’s most revealing moment occurred when Powell resignation rumors sparked a brief SPX stumble, validating our thesis that markets are underpricing anything short of perfection. The recovery was driven by substantial 0DTE flows, with massive covering of 6,180 puts specifically igniting the rally back to 6,250.
As we noted in our Wednesday AM Founder’s Note, those SPX 6,180 0DTE puts saw 5x returns in under two hours. Despite the market staying 20+ points above the strike price of these contracts, SpotGamma’s TRACE heatmap shows how 6,180 developed into a highly influential level intraday.
Stock Highlights: NFLX Earnings & Meme Mania
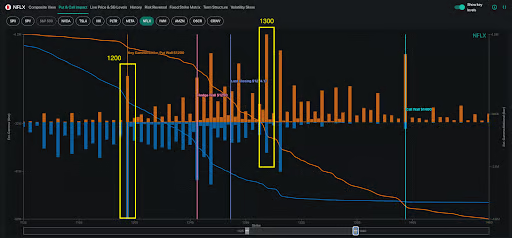
Earnings season is here, with Netflix having kicked off big tech reporting this week. Prior to Thursday’s after-hours earnings release, the options market had priced in an $80 implied move. Post-earnings, the stock initially rallied to the $1,308 area, where it stalled between the significant positive gamma levels at $1,300 and $1,310.
NFLX soon sold off to the $1,230 area, and continued the decline the following day right into the $1,200 put wall before bouncing.
From reading our Tape order flow tracking, we see the top 10 largest trades for NFLX are deep ITM puts ($1,580 strike) expiring in August, indicating further selling pressure may yet lie ahead.
Our Synthetic OI model also urges caution for NFLX, since the stock will likely enter a negative gamma regime following July OPEX. We will keep an eye on open interest changes in the next week as we watch how price action reacts to the $1,200 key level.
While big tech stock momentum seems to have cooled off, meme stock mania made a dramatic comeback, flashing potential late-stage rally signals. LCID (+36%) became a standout on Tuesday, actually outtrading TSLA in options volume. Then on Thursday, OPEN saw a staggering 890k contracts traded. Names like SOUN, BBAI and JOBY showed similar squeeze patterns over the past several days.
Post-OPEX: Potential “Window of Weakness”
July OPEX presents us with a heavily call-weighted expiration: 91% of expiring value in major indices, and 78% in single stocks, were concentrated in calls. When calls are bought by traders, this creates significant hedging pressure as market makers must buy underlying stocks to hedge their own short call positions, generating an upward feedback loop that supports prices.
However, once these calls expire, the hedging-driven buying pressure disappears, removing a key pillar of market support. Notably, we observed that the February, March, and May expirations were similarly call-heavy, and each of those expirations were followed by trend reversals. This suggests July OPEX could mark an inflection point for market momentum.

This removal of positive gamma could give way to a broader market correction, with the potential for a 2-3% pullback of the S&P 500 into the 6,000-6,100 range. Two major upcoming market catalysts include the FOMC meeting on 7/30 and the tariff deadline on 8/1, making two-month SPY puts and VIX call spreads potentially attractive ways to play expected volatility expansion from a risk-reward standpoint.
Want to better track key levels and order flow dynamics, including real-time tools and pre-market commentary each day? Explore SpotGamma’s platform designed to give traders the edge in today’s options-driven markets.